Crop Type Classification Using Remote Sensing
Classification of field crops is an essential part of agriculture as a business. Identifying crops using traditional methods can be quite a daunting task.
EOSDA offers a faster and much easier way of solving this problem relying on years of experience in precision agriculture, as well as expertise in the application of AI-powered algorithms, and remote sensing.
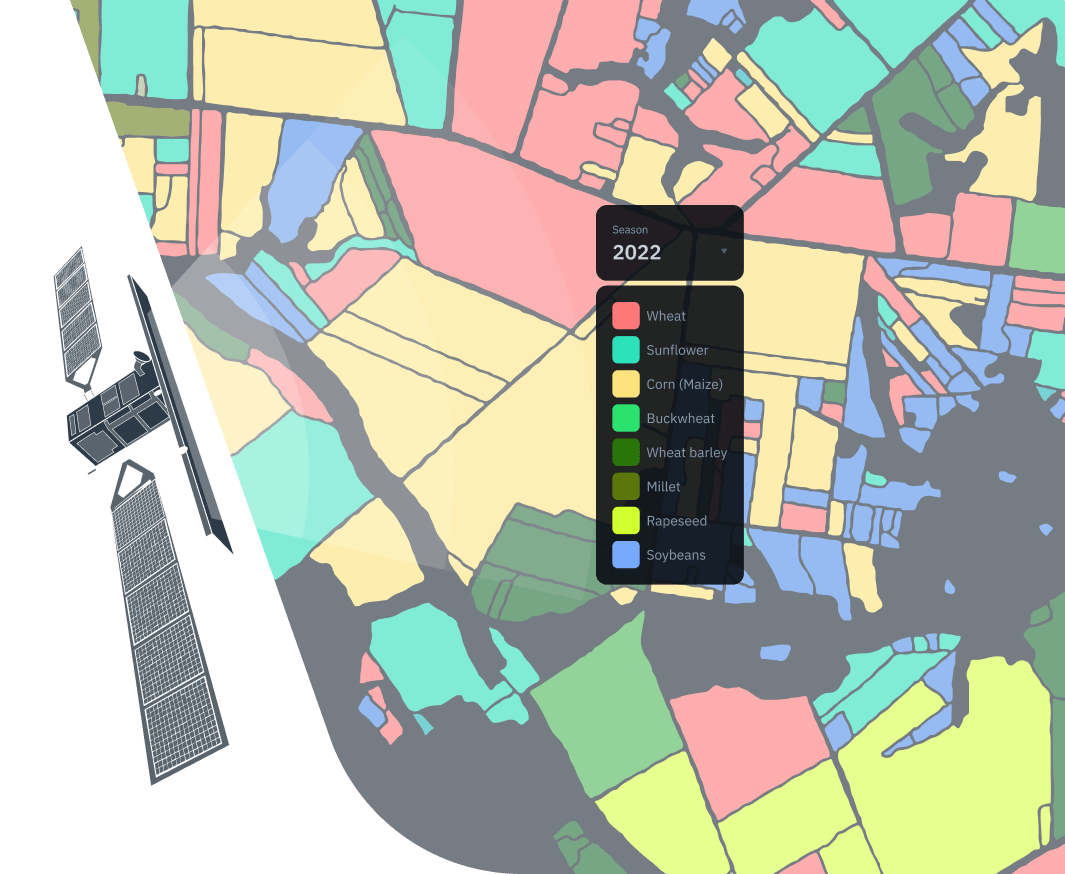
By combining Synthetic Aperture Radar (SAR) data with optical imagery, we can assign a class to each type of crop recognized by a trained neural network in any area of interest and build a crop type map suitable to the customer’s needs.
Crop Classification Solution In Numbers
Crop type maps with an accuracy of up to 90%, depending on the completeness of ground data and availability of regular satellite scenes.
Get cropland masks at a 10-m resolution in .geotiff or .shp formats.
Crops identified for any area, even as small as 3 ha.
Our algorithm identifies crops almost anywhere on Earth.
If conditions are favorable, our qualified RnD team requires only several weeks to complete research and deliver an accurate crop classification map to you.
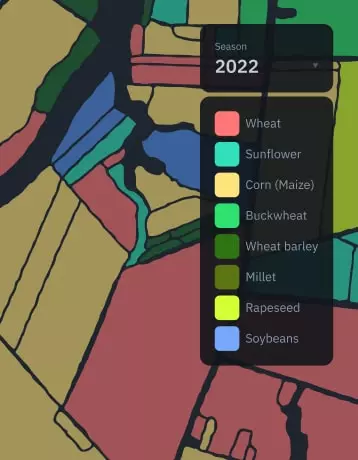
Our trained neural networks can classify over 15 different types of crops.
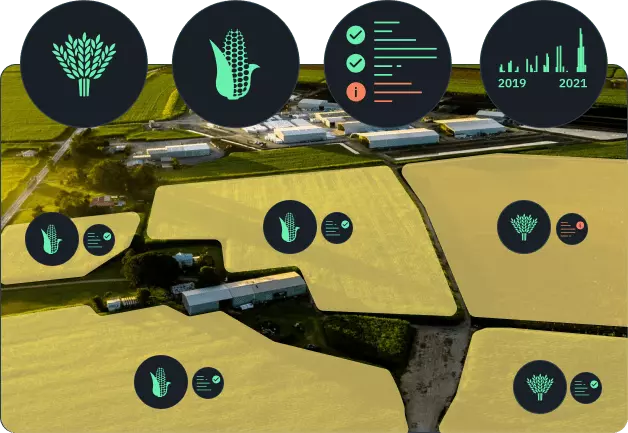
What Crop Classification Achieves
- Taking inventories for large areas and estimating yields.
- Keeping extensive crop rotation records for selected areas.
- More transparent crop type data for the validation of compensation requests.
- Management of land use is much easier with crop type data.
- Crop identification allows traders to set price points on the market.

Advantages Of Our Approach
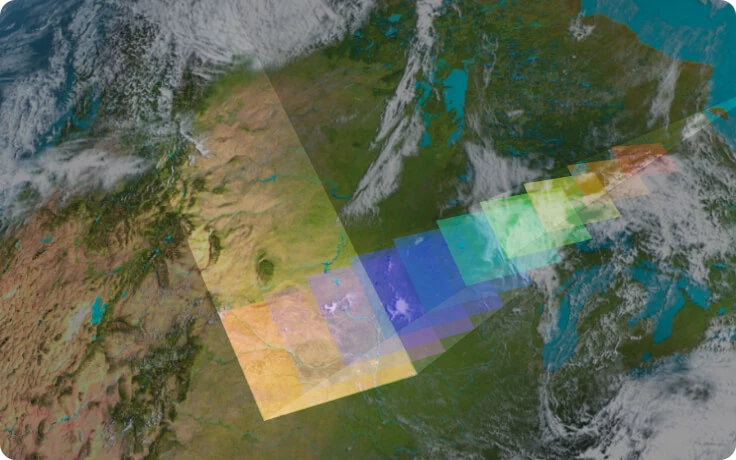
Data obtained only from the optical satellite imagery may be incomplete or non-existent due to cloud coverage, fog, etc, making crop identification difficult or impossible.
Synthetic Aperture Radar (SAR) is an active sensor emitting microwave radiation. As a result, it does not require the reflected sunlight to collect data from an area of interest. By combining SAR data with optical imagery, we easily solve the cloud coverage problem. In fact, this allows us to classify crops in an image that is taken in poor visibility or even at night.
Relying on Sentinel-2 time series of multispectral images means there’s quite a lot of data to process even for one tiny field.
Our arsenal of pre-trained models can handle almost any request. For any new area or crop type, we can easily adjust the existing neural network models and quickly obtain results.
Classification of crops over vast areas is more problematic because each satellite can only capture a limited area at a time.
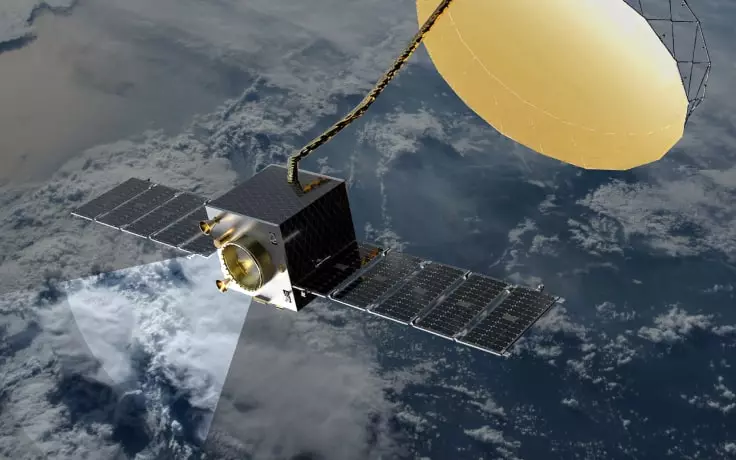
Thanks to the pixel-based segmentation performed by our deep-learning algorithms, we can obtain more data in a shorter period of time. Crop classification can also be carried out much faster if we receive complete and accurate ground-truth data for the region of interest. In the near future, EOSDA will have its own satellite constellation (EOS SAT) in orbit, which will significantly reduce the final delivery rate of our custom solutions.
Our Success Stories
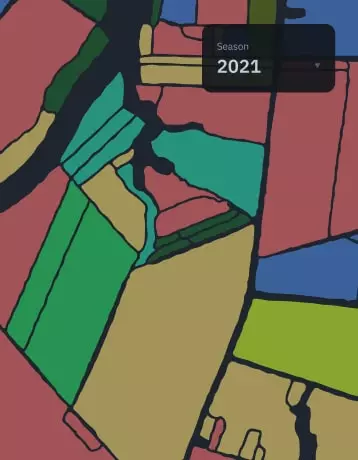
Crop Classification For Ukraine
Challenges:
- Identify land cover types (cropland, forest, etc.) for an area of 60 mln ha.
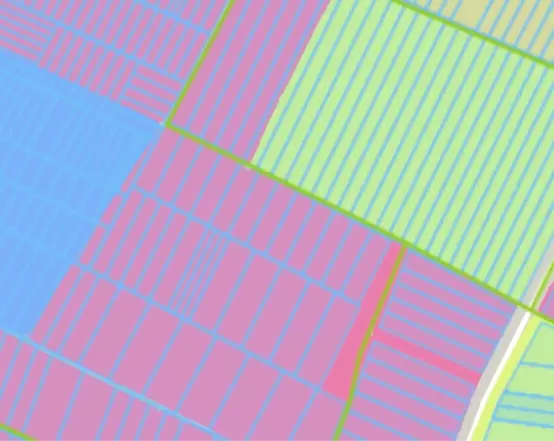
- Detect and define the boundaries of agricultural fields on the map.
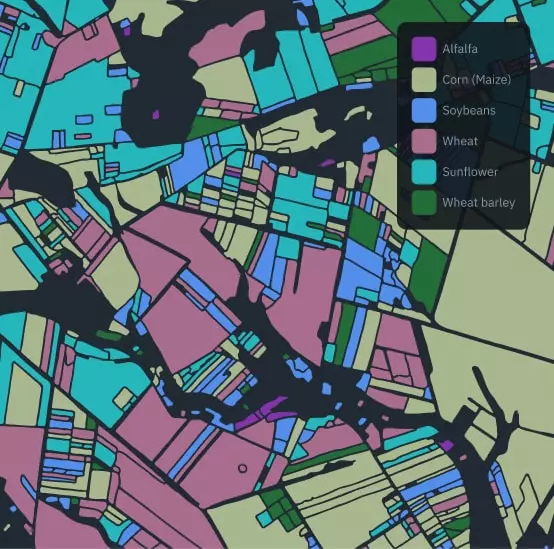
- Classify up to 15 types of crops across 41 mln ha of cropland.
Solutions:
- Collected ground-truth data.
- Preprocessed the input data.
- Prepared datasets.
- Performed data labeling and launched ML algorithm.
Outcomes:
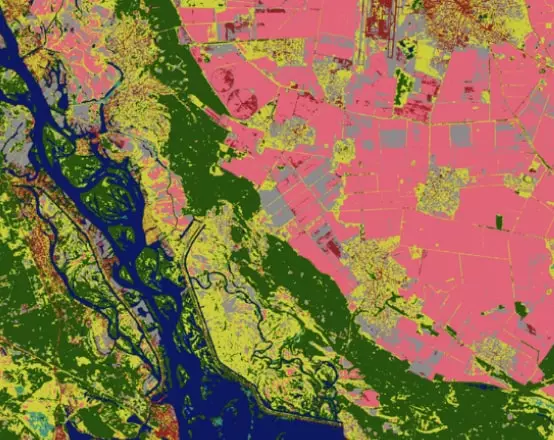
We classified the following types of land cover:
- Forest
- Artificial objects
- Water
- Cropland
- Bare land
- Wetlands
Cadastral map of Ukraine
- The classified fields (Crop map), ha66.9 K
- The registered land (Cadastre), ha73 K
- The unregistered land (Cadastre), ha17.5 K
- The classified fields within the unregistered land, ha8.2 K
Accuracy of crop classification for 2021

Detection Of Sugarcane Mills In Brazil
Challenges:
- Detection of Sugarcane in Brazil (area estimation).
- Simple methods of satellite data segmentation do not provide an accurate to the problem of identifying sugarcane for Brazil.
Solutions:
- Used a convolutional LSTM (Conv-LSTM) model to detect sugarcane within specified areas.
- The classification method is based on the convolutional LSTM (Conv-LSTM) model which combines the benefits of convolutional (CNN) and long short-term memory (LSTM) networks and allows for the analysis of data both in space and time.
- The model has been trained on a dataset from 10 different countries of the world that were marked by the EOSDA specialists.
Outcomes:
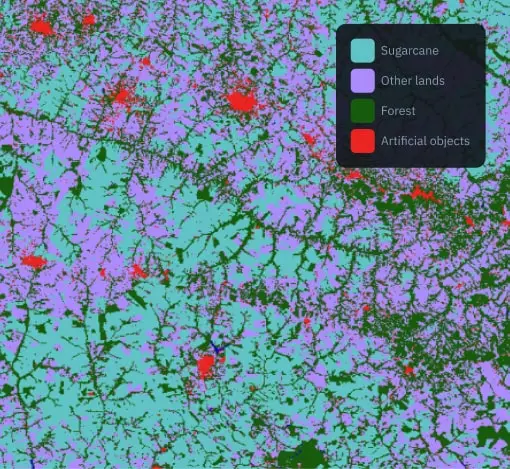
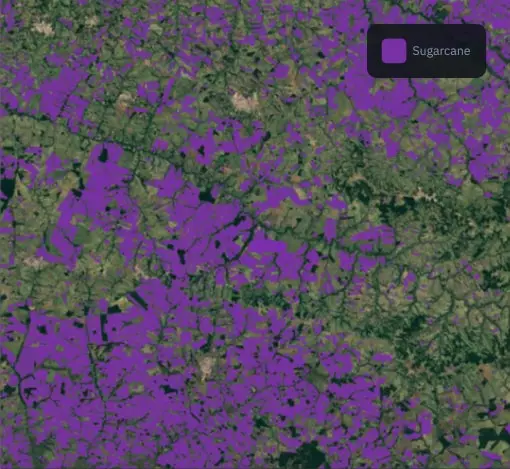
In the sugarcane classification problem, the methods of bidirectional recurrent neural networks based on LSTM and Convolutional LSTM demonstrated almost identically high overall accuracies (over 94%).
To assess the accuracy of land cover classification maps, as a rule, a confusion matrix is used, obtained from an independent test sample, as well as the following metrics: Overall Accuracy (OA), Kappa index, Producer Accuracy (PA), and User Accuracy (UA).
UA and PA values are ways of representing the accuracies of the individual classes. The UA value is the probability that the pixel class on the classification map corresponds to the sample class in the test data, whereas PA indicates the probability that a pixel from the test data is recognized correctly on the map.
Overall Accuracy (OA) is an indicator of the overall quality of land cover map.
Kappa coefficient is a statistical measure of the consistency between the obtained classes on the land cover map and the classes that are real (test data).
Another metric for the assessment of the classifier quality is F1 score. It reduces the two other metrics, UA and PA, down to one number, and it is defined as an average-weighted harmonic mean value between them.
| Without Field Boundaries | With Field Boundaries | |||||
|---|---|---|---|---|---|---|
| UA | PA | F1 | UA | PA | F1 | |
| Sugarcane Without Field Boundaries With Field Boundaries UA PA F1 UA PA F1 | ||||||
| Sugarcane | 93.8% | 84.1% | 88.7% | 91.2% | 87.0% | 89.1% |
| Other lands Without Field Boundaries Wit Field Boundaries UA PA F1 UA PA F1 | ||||||
| Other lands | 93.5% | 97.6% | 95.5% | 95.1% | 96.7% | 95.9% |
| Overall Accuracy Without Field Boundaries Wit Field Boundaries UA PA F1 UA PA F1 | ||||||
| Overall Accuracy | 93.6% | 94.0% | ||||
| Kappa Without Field Boundaries With Field Boundaries UA PA F1 UA PA F1 | ||||||
| Kappa | 0.84% | 0.85% | ||||
UA metric is well balanced, while PA difference indicates the prevalence of statistical errors of the first kind - in other words, the prevalence of false positive over false negative predictions. An analysis of classification errors for sugarcane relative to Other Lands subclasses indicates that the Other Crops class accounts for the largest share of false positives. Additional crop classes would allow for a further improvement in the quality of classification.