Satellite Monitoring For Insurance In Agriculture
As droughts, floods, and other climate-driven calamities are getting more frequent, agricultural production worldwide is facing unprecedented risks.
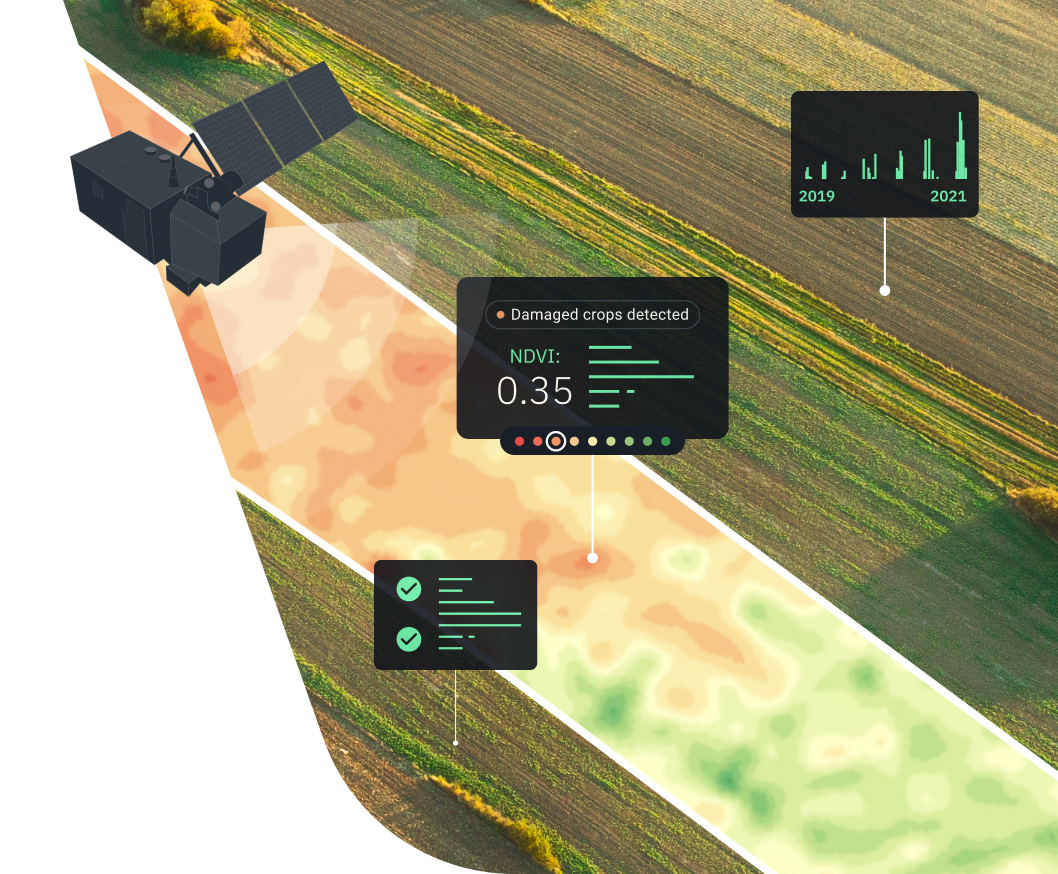
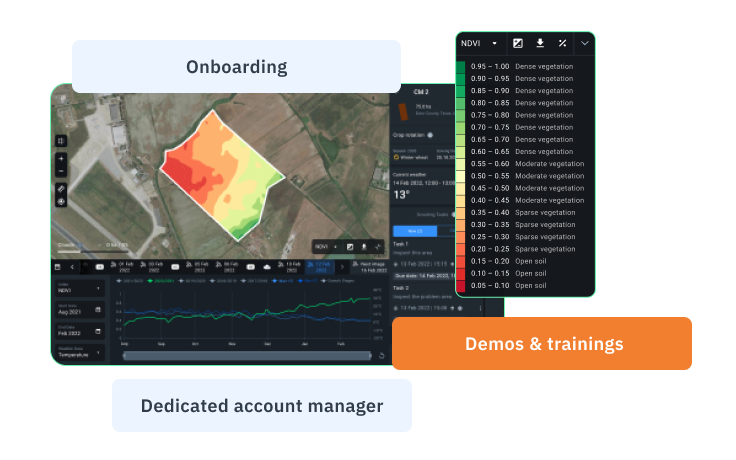
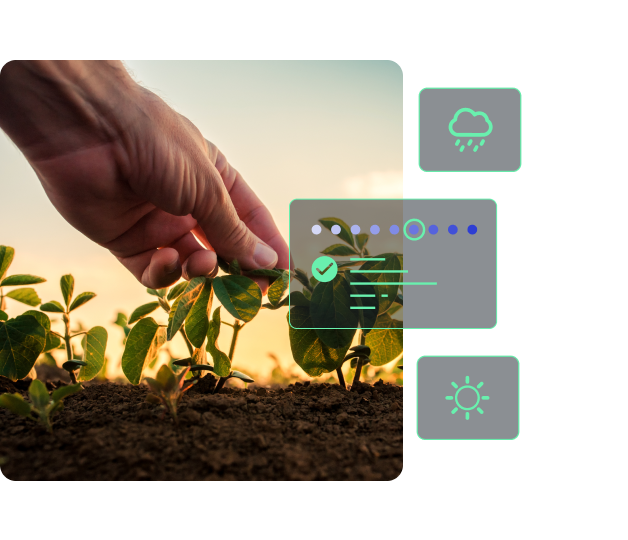
EOSDA Crop Monitoring platform enables satellite-based monitoring of fields using an array of vegetation indices alongside current and historical weather data analytics. These can be used as insured events in indemnity- and index-based crop insurance to craft policies that protect farmers against uncalled-for risks and financial losses.
Agricultural Insurance Challenges: How EOSDA Helps
Missing or unorganized data about fields for customer risk-profiling
Our digital platform integrates multiple types of data in one place and provides historical field analytics in digestible form. Whenever you get an insurance request from a new client, you can instantly browse information about their field or entire region in our platform to check field productivity for past seasons, historical precipitation and temperatures. No more wasting time on ground truthing or gathering weather data from meteostations - our tool has got you covered!
High operational and administrative costs of insuring geographically dispersed croplands
Remote observation of fields with EOSDA Crop Monitoring allows cutting costs of risk assessment and damage evaluation compared to the traditional boots-on-the-ground approach. The platform's Scouting feature also optimizes all actual field visits by sending scouts straight to the problem areas to avoid 'blind' checkups.
Tıme-consuming claim validation
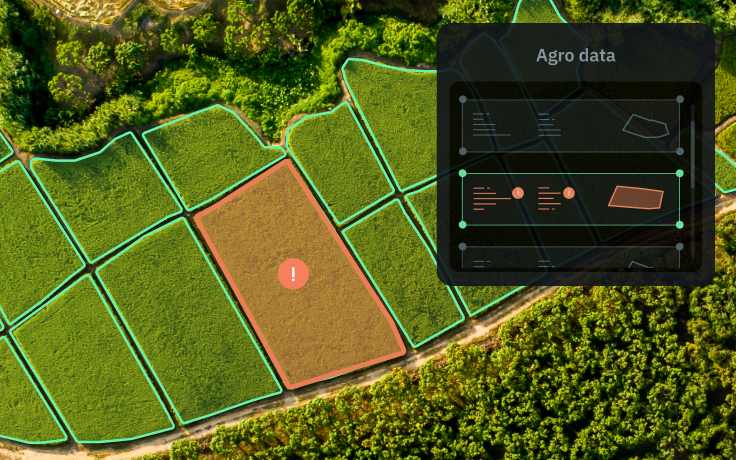
Based on indices available in our tool, you can remotely detect and verify the occurrence of insured events, saving time and enhancing the accuracy of claim validation which also decreases the risks of potential disputes. When integrated into your agriculture crop insurance management system, the platform will also provide insights on weather conditions and crop yield history of fields required for application processing.
Constant policy review due to ever-changing risks caused by climate change
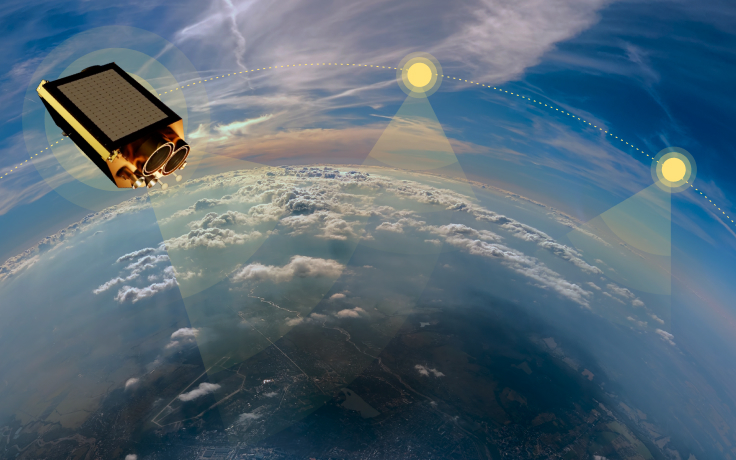
The latest and historical satellite imagery in EOSDA Crop Monitoring simplifies the tracking of changes in plant productivity and weather patterns to keep policy and payout grid relevant. With the launch of our own agri-focused EOS SAT constellation that will supply satellite data of higher temporal, spatial, and spectral resolution, the benefits for agricultural insurance companies will increase.
Lack of trust and transparency between contract parties
Gain customer trust by providing access to a reliable source of up-to-date information on crops, fields, weather, etc. available in our platform's team account. It will keep all parties of the insurance contract equally well informed in case of insured event occurrences and provide additional value to your agriculture insurance solutions.
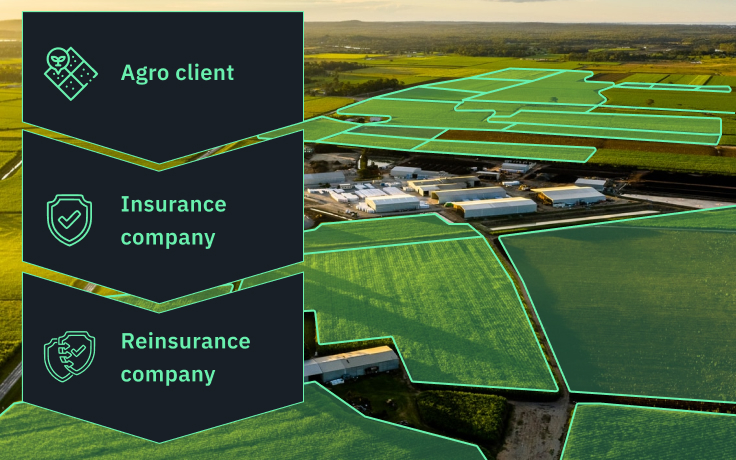
Simple, scalable risk assessment as a prerequisite for international agriculture reinsurance
Remote sensing indices serve as objective and scalable parameters that let agricultural insurance companies see the real picture, be it a small plot or an entire region. Leverage an array of EOSDA Crop Monitoring's vegetation and soil moisture indices to expand your company's portfolio with reinsurance coverage offerings.
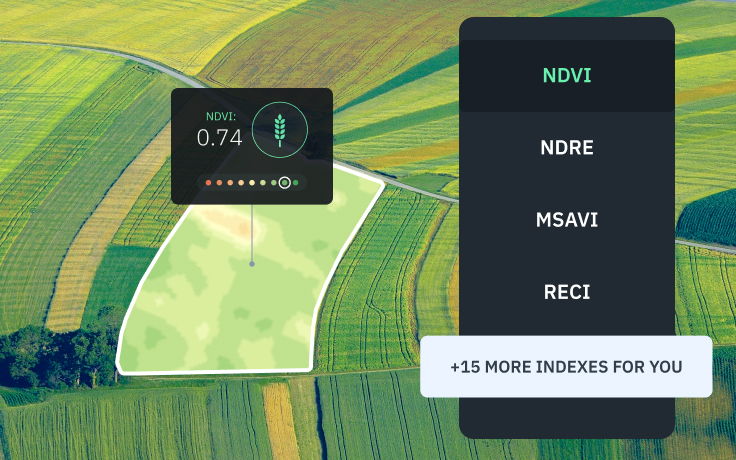
Every field is unique and needs an individual set of indices
Our platform offers over 15 satellite-derived vegetation indices. Taking into account the cultivated crops, local climate, topography, and field history, you can choose instruments that will be more efficient for each particular insured case. Moreover, you can create dedicated agriculture insurance software based on our platform adding current indices and data or entrust us with crafting a tool version that features custom indices tailored to client needs.
Lack of satellite technology understanding and its use in index insurance for agriculture among farmers
Our EOSDA Crop Monitoring can act as a platform bridging the gaps in knowledge of cutting-edge satellite technologies within farmer communities. By giving them access to the tool, insurers can illustrate the utility of vegetation indices, weather analytics, and other parameters in index-based insurance, improving overall awareness and driving technology uptake.
EOSDA Crop Monitoring — One Solution For Different Types Of Insurance
Less than 20% of the world's smallholder farmers can buy traditional crop insurance due to the high cost of premiums and on-site loss assessment. Our satellite data-driven platform provides insights for agricultural business insurance, enabling companies to speed up claim validation and facilitate damage estimation to offer more affordable policies that protect farmers against weather and climate risks.
Yield-Based Insurance
Our tool provides reliable data to simplify yield loss assessment and enhance yield insurance, including area yield index insurance.
-
Vegetation indices
Check on insured plants with NDVI, ReCI, MSAVI, and a dozen more advanced vegetation indices, get instant alerts when insured events occur, and speed up the calculation of crop index based insurance payouts.
-
Field monitoring and historical data
Historical satellite field productivity data and ongoing monitoring enable efficient setting of insurance index and policy price and verifying the cause of agri-production losses.
-
Scouting app
Optimize scouting efforts manyfold with our app: precise problem location spotting, easy task setting, and offline performance.
Hail Insurance
EOSDA Crop Monitoring integrates weather and satellite data, and a convenient analytics feature set for objective, less labor-intensive hail damage assessment in agricultural business insurance.
-
Weather monitoring
Strengthen weather index based crop insurance products with reliable weather data: know where hailstorm events occurred and outline hailstorm-affected areas.
-
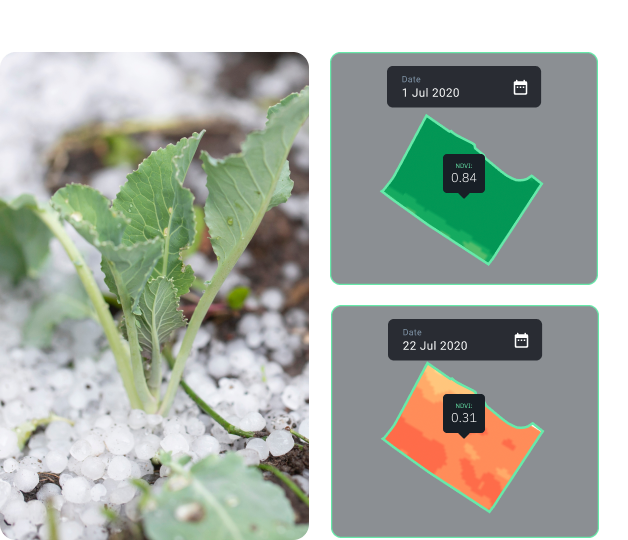
Split view
Compare satellite scenes from diffferent dates to detect and measure hail damage to plants.
-
Scouting app
Scouting app facilitates on-field checkups of hail-damaged zones.
-
Historical field data
Agricultural insurance can rely on satellite-derived field data for past seasons to determine hail risks and set a threshold level of weather variables.
Drought Insurance
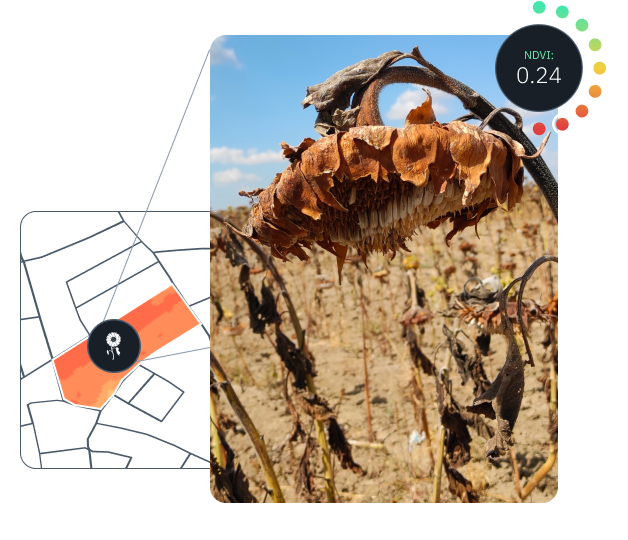
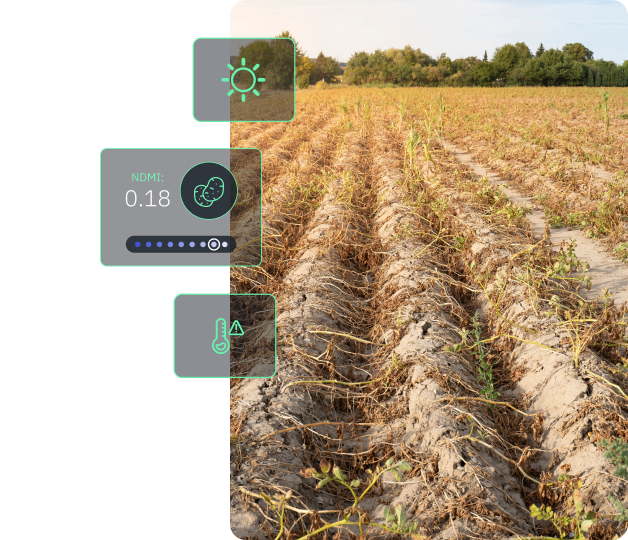
Vegetation indices, soil moisture, and evapotranspiration data in EOSDA Crop Monitoring are useful indicators of drought and related yield losses, which makes it a perfect tool for insurance in agriculture.
-
Soil moisture data
Precise surface- and root-level soil moisture data obtained without the use of sensors serves as an objective insurance index.
-
Historical weather data
Historical precipitations and temperatures are used to set the critical threshold that triggers payouts in a drought/rainfall index insurance scheme.
-
Historical field data
It enables agriculture insurance companies to trace the correlation between field parameters and drought-related crop losses and predict risks more efficiently.
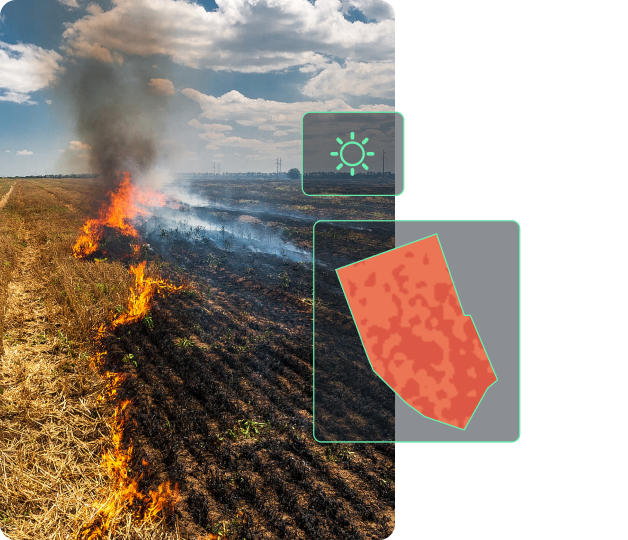
Crop Fire Insurance
Rich field-level data in EOSDA Crop Monitoring sustains agriculture insurance products covering field fires to help farmers thrive under agricultural challenges.
-
Historical weather data
Monitor current precipitations and get a regional weather overview for past seasons to predict fire risks that increase with below-average rainfall.
-
Advanced vegetation indices
Identify high fire hazard zones with a fire detection index available at customer request.
-
Soil moisture data
Soil moisture has a strong correlation with fires as dry biomass is more likely to ignite. Detect pre-fire soil moisture anomalies, validate post-fire insurance claims, and offer remote sensing-based index insurance plans.
-
Split view
Spot damage by comparing pre- and post-fire satellite scenes.
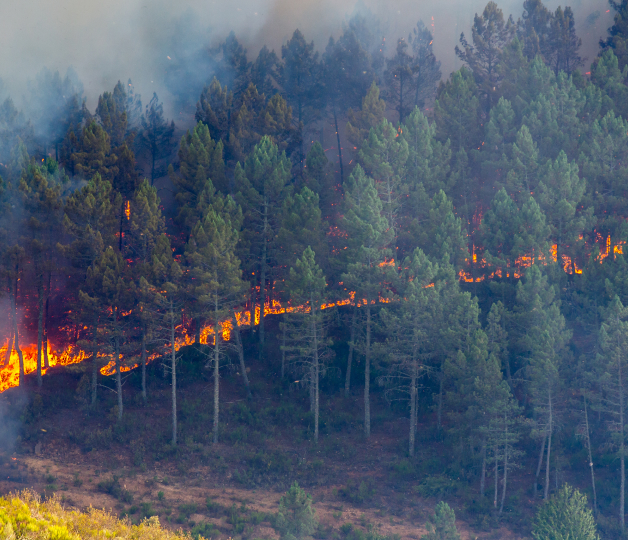
Forests suffer from fires alongside crops. Our digital platform provides a solid basis for forest fire insurance with thermal anomaly and water stress detection.
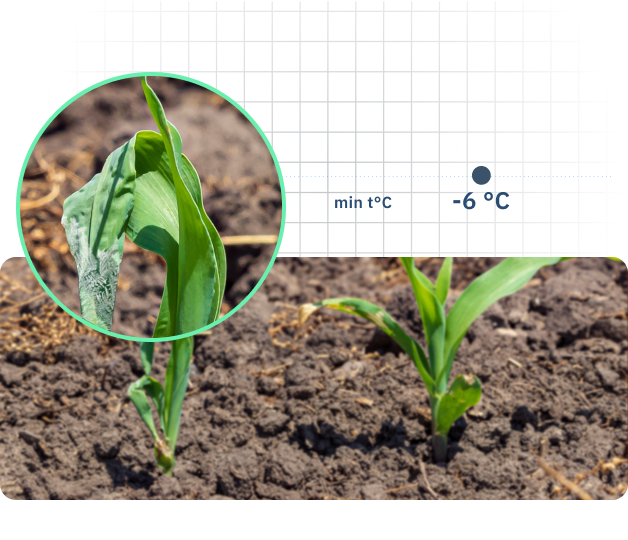
Cold Stress Insurance
Frosts cause 30% of weather-related insured crop losses in temperate climate regions. With EOSDA software, any agriculture crop insurance company can efficiently predict frost risks, set plant variety-specific triggers, and measure damage.
-
Historical weather data
Analyze temperature records for past seasons to identify frost event patterns and probability of cold stress in the insured plants.
-
Crop classification
Crop classification enables more feasible agricultural insurance: as each plant species has its own productivity rate and cold tolerance ability, this data is key to setting up crop-specific triggers and payout grid.
-
Split view
Detect cold damage in plants with pre- and post-frost satellite images.
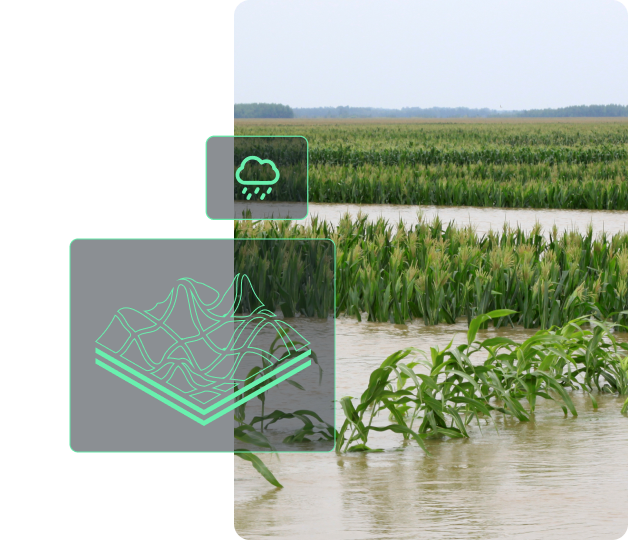
Flood Insurance
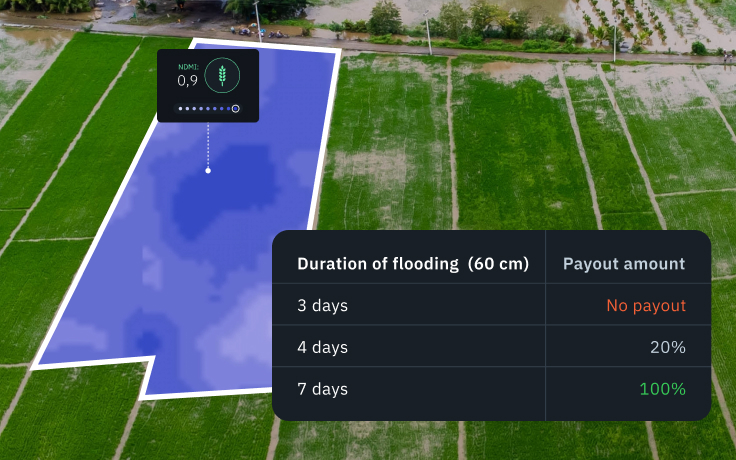
Floods ruin crops and make fields unfit for planting. Our tool offers data-driven intelligence that improves flooding risk discovery in various types of agricultural insurance, including parametric flood insurance.
-
Historical weather data
Past precipitation records are instrumental in identifying heavy rainfall risks and price-setting for rainfall index crop insurance.
-
Soil moisture index
Historical soil moisture index shows soil susceptibility to flooding and saturation level. Combine it with other field data to set an accurate index threshold signaling the flooding.
-
Elevation map
Low-lying parts of a field can be prone to flooding. With elevation maps, insurers can set zone-specific critical thresholds.
Multi-Peril Index Insurance For Agriculture
Multi-peril insurance policies protect farmers from financial losses incurred due to a number of factors. With EOSDA Crop Monitoring at hand, agriculture crop insurance providers can come up with schemes covering various peril combinations on a case-per-case basis. For instance, flood-prone fields in regions with frequent storms can be insured against flooding and hailstorm incidents.
Use the platform to the fullest by taking several indicators into account for validating insured events: vegetation indices, soil moisture index, historical weather data. Our platform is a reliable source of data that will keep you safe from false claims and moral hazards.
Other useful features EOSDA Crop Monitoring has to offer:
- Vegetation monitoring at early development stages
- Detection of winter-killed plants
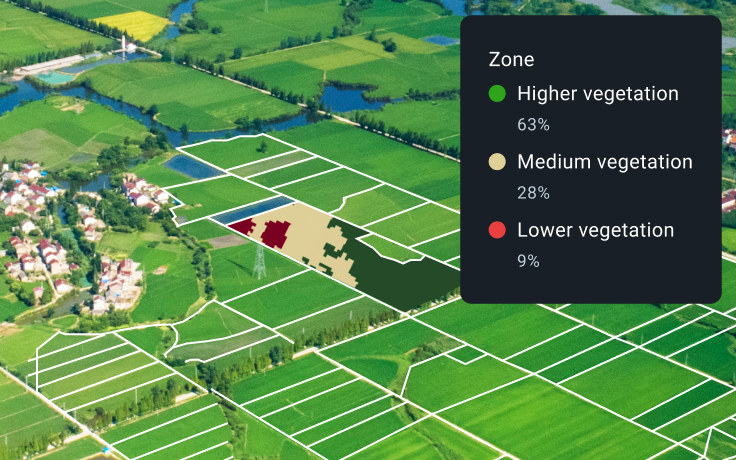
- Field rating based on NDVI performance
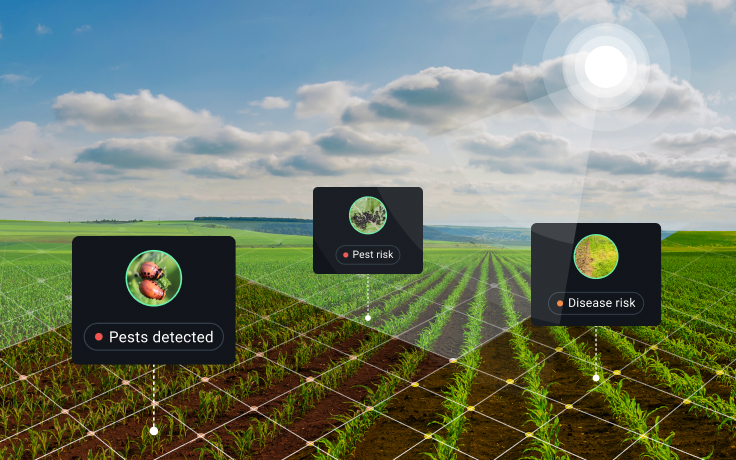
- Automatic alerts about heat/cold stress and vegetation index changes signaling the insured event occurrence
Individual Business Solutions At Request
Partnership Opportunities
Partnering with EOSDA is a shortcut to scaling up your insurance business, increasing profits, and strengthening market presence while staying true to sustainability goals.
Discover the potential of combining insurance and remote sensing GIS techniques for the benefit of your customers with our demos, training sessions, webinars, and all-round support from tech and marketing teams.
Refine the accuracy of your agriculture insurance products with EOSDA Crop Monitoring platform. Resell access to small insurance businesses, insurance brokers, governmental institutions, agri-cooperatives, affiliated insurance companies and join our global partner network.

Custom solutions
On top of default platform functions, we offer tailored solutions. Contact our representative to learn how our expertise can help farming insurance businesses thrive.
- Get yield prediction to better assess agricultural production risks. Our machine learning algorithms coupled with historical data trends and weather intelligence produce 85-95% accurate yield predictions depending on the time left until harvesting.
This data holds great potential for banks in setting the conditions for farm loans, which can be bundled with insurance policies to create more value for money.
- Learn harvest dynamics across several seasons and make better decisions with such data as harvest dates, total field number, total harvested acreage.
- Access advanced soil moisture data at the surface and root level to enhance agricultural business insurance. With advanced soil moisture maps of any scale, you can stay on top of drought trends, make accurate crop yield estimates, and generate feasible insurance policies with precise index triggers.
- Detect field boundaries to rule out mistakes in insurance claim validation. Make sure you exclude adjacent fields while analyzing vegetation and weather data.
- Get crop classification maps for current and past seasons to set plant variety-specific insurance premiums. Prevent fraud by checking if planted crop type matches the one stated in the policy and find new clients that grow targeted plant species.
API
- Fast, easy API access to satellite data for agriculture insurance products
- An array of vegetation indices (Sentinel, Landsat)
- Comprehensive weather data since 2008 (air temperature, precipitation, cold/heat stress, evapotranspiration)
- LAI and proxy biomass data for crop yield modeling and satellite-based insurance policies for pasture and grassland
- Soil moisture data (available since 2002)
Case Study: Insurance Project For Macedonian Company
- Accurate data on the insured event occurrence (hail damage) for claim validation.
- Collect information about hail events during the claim period and verify if against the list of croplands with claimed damage.
Stage 1: Preparation. Make up a list of fields whose owners filed claims for crop losses due to hail, establish their location and claimed damage.
| Date of event | Cause of loss | Claimed damaged area | Confirmed damaged area | |
|---|---|---|---|---|
| Wheat Field | Date of event 15.07.2021 | Cause of loss hail | Claimed damaged area 20% | Confirmed damaged area 20% |
| Corn Field | Date of event 7.08.2021 | Cause of loss hail | Claimed damaged area 50% | Confirmed damaged area 0% |
| Barley Field | Date of event 4.05.2021 | Cause of loss hail | Claimed damaged area 100% | Confirmed damaged area 70% |
Stage 2: Data collection. Check if there were records of precipitation and hail event occurrences in the fields of interest. Additionally, determine the size of hailstones, if any.
Stage 3: Data analysis. Analysis of the obtained hail data showed a high probability of hailstorm occurrence on 2 out of 3 fields (except for the corn field).
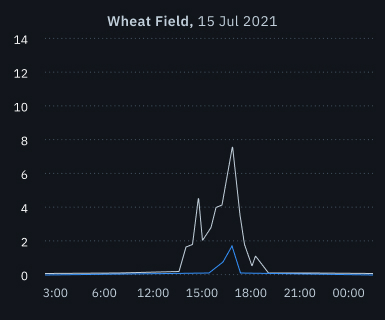
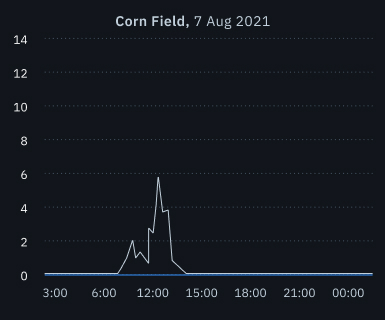
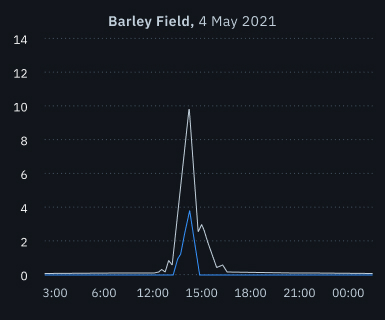
- Precip, mm
- Hail, cm
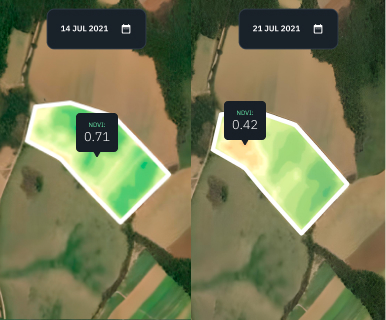
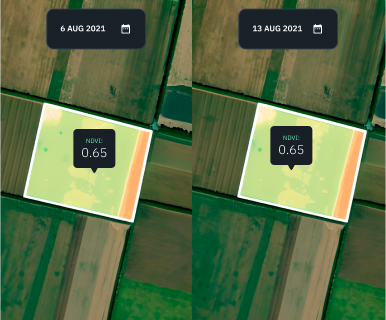
Stage 4: Cross-checking results against satellite data. The Split view feature enabled us to compare satellite scenes before and after the alleged hail events, detect vegetation index changes within fields, and measure hail damage.

Conclusion:
claims have been validated for 2 out of 3 fields where hail damage was confirmed.
The entire analysis was carried out using the remote sensing technology in insurance, without on-field scout visits, which significantly reduced data processing costs and time.
Wheat Field
The field underwent a comprehensive audit. The policyholder is entitled to a full insurance payout.
Corn Field
The occurrence of the insured event wasn't confirmed either through satellite image analysis or based on weather data.
Barley Field
A hail event was confirmed for the claim period, however, the actual damage was less than what was claimed.