Remote Harvest Dynamics Monitoring
At EOSDA, we know how the lack of or gaps in harvest statistics can affect the planning of field activities and development of sales strategies.
With this in mind, our expert team of GIS specialists and data scientists developed a remote harvest monitoring methodology - determining the harvest status for individual fields on particular dates over large areas. With this technology, you’ll stay well-informed on harvest progress in all of your fields on chosen dates. Plan smart and sell big with EOSDA harvest dynamics monitoring.
How harvest dynamics monitoring can boost your business
- Harvest logistics improved thanks to the harvest status maps.
- Adjust tillage, seed & fertilizer rate with timely harvest analytics.
- Improve the application of insecticides and herbicides to enhance future crop production.
- Put your best efforts (workforce and machinery) to harvesting at the earliest.
- Enhanced logging and documentation to boost decision-making.
- Plan crop rotation more efficiently.
- Monitor and manage harvesting contractors with ease.
- Add value to your business by keeping accurate harvesting records.
- Greatly reduce resource and management constraints of ground-based harvest monitoring.
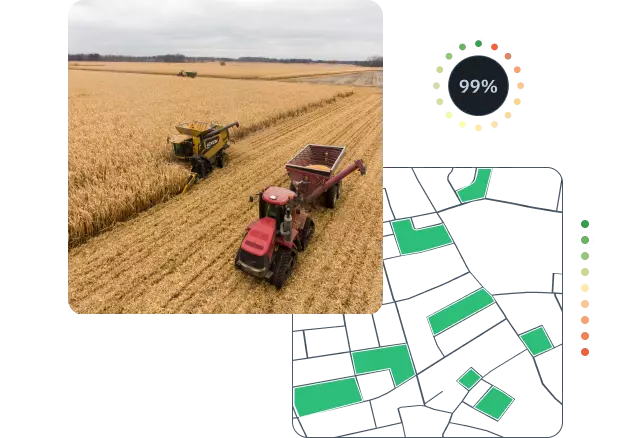
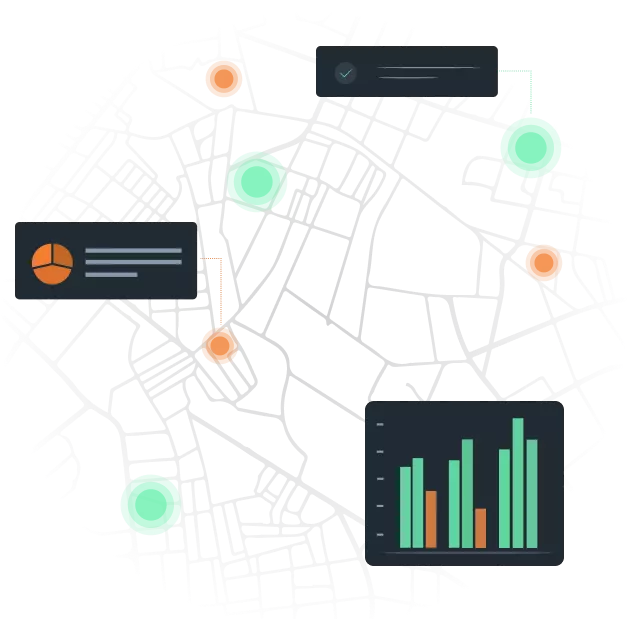
Precision harvest monitoring in action
No matter where harvesting takes place, thanks to EOSDA remote harvest monitoring technologies, your agronomists and other experts will know exactly which field to inspect and when
Science behind it all
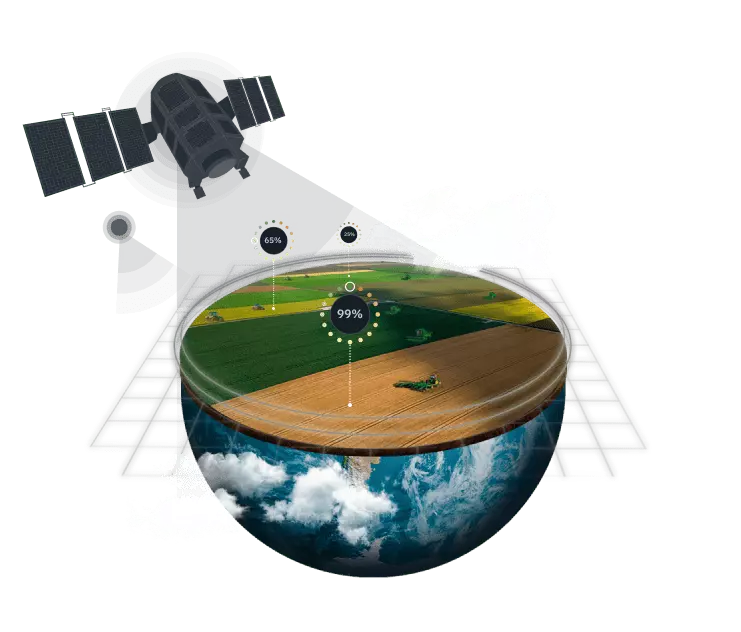
As satellites orbit the Earth, they can revisit a particular area of interest once every 3-4 days taking a snapshot (e.g. of a single field or group of fields). The image then gets processed and analyzed picking up subtle changes in the wavelengths of light reflected off the crops as they develop throughout the season.
Next, using a specially developed algorithm, the EOSDA team accurately calculates the plants' dry matter content, which then allows to determine the harvested status.
Our approach
EOS Data Analytics team of GIS specialists and data scientists employ cutting-edge remote sensing technologies for effective harvest monitoring.
Our methodology consists of several steps:
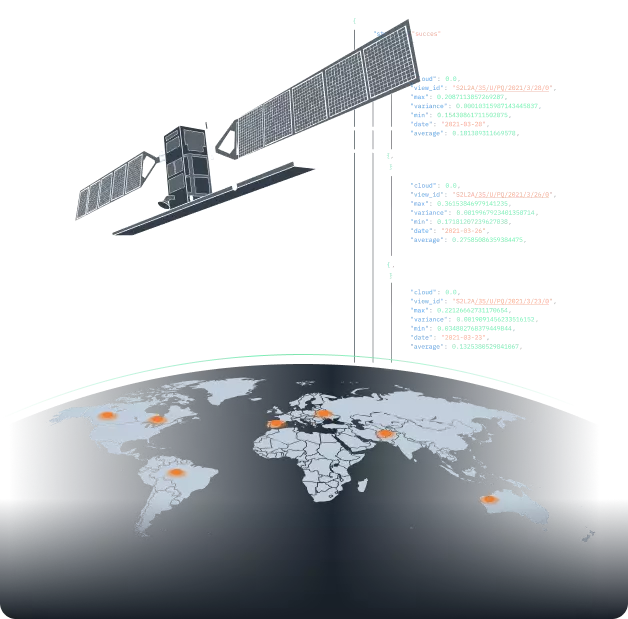
1. Obtaining Sentinel-1 SLC radar data and Sentinel-2 optical data.
2. Constructing time series of interferometric coherence with the radar data.
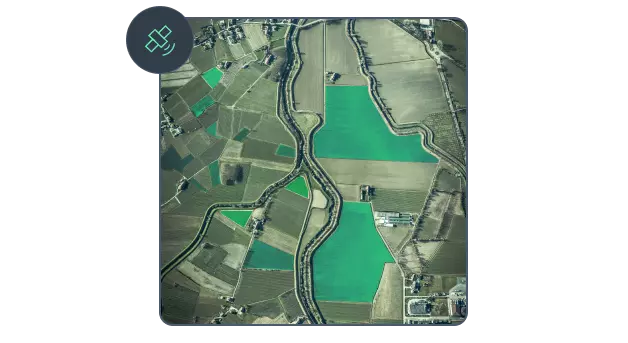
3. Plotting the Normalized Difference Vegetation Index (NDVI) time series using the optical data. The sharp drop in the NDVI, followed by low values during a prolonged period of time, corresponds to harvesting.
4. Processing imagery via automated pipeline to deliver results within 2-3 business days on the image aqcuisition.
Case study
Sugarcane harvest monitoring for Brazil in 2021
The task was to define a ratio between harvested area and the total area of the field - an area of 47,000 hectares (6,500 fields) - for the period of 3 months starting in May of 2021.
Detect a harvested index (status) of a field on a particular date:
- Completely harvested - 100%
- Not harvested - 0%
- Partially harvested from 1% to 99%
Our sugarcane harvest monitoring approach was based on Sentinel-1 SLC radar data and Sentinel-2 optical data, namely:
- Radar time-series of interferometric coherence;
- Optical NDVI time series. The sharp drop in NDVI followed by low values over a long period of time strongly correlates with harvesting.
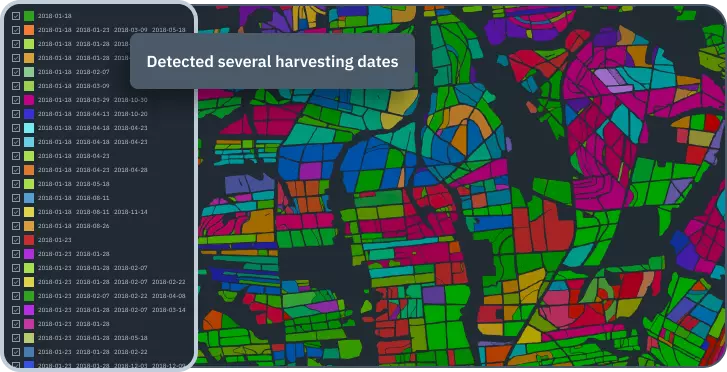
An analysis of the obtained criteria made it possible to determine the harvest dates for vector polygons classified as sugarcane sections.
The EOSDA team successfully determined the harvest status for the plots for 93% of the observed area. Multiple harvest dates were determined for 10% of plots (on-going harvesting).