EOSDA Crop Monitoring Guide Search
Add Forest Stands
So, you’ve logged in to the EOSDA Forest Monitoring app. Where to begin?
Each new account is equipped with 1 demo stand to get acquainted with EOSDA Forest Monitoring functionality.
To monitor deforestation, thermal anomalies, forest productivity, water stress, and other parameters on your stands, please add them to your list of forest stands first*.
*To get access to all of the available features, upgrade your plan
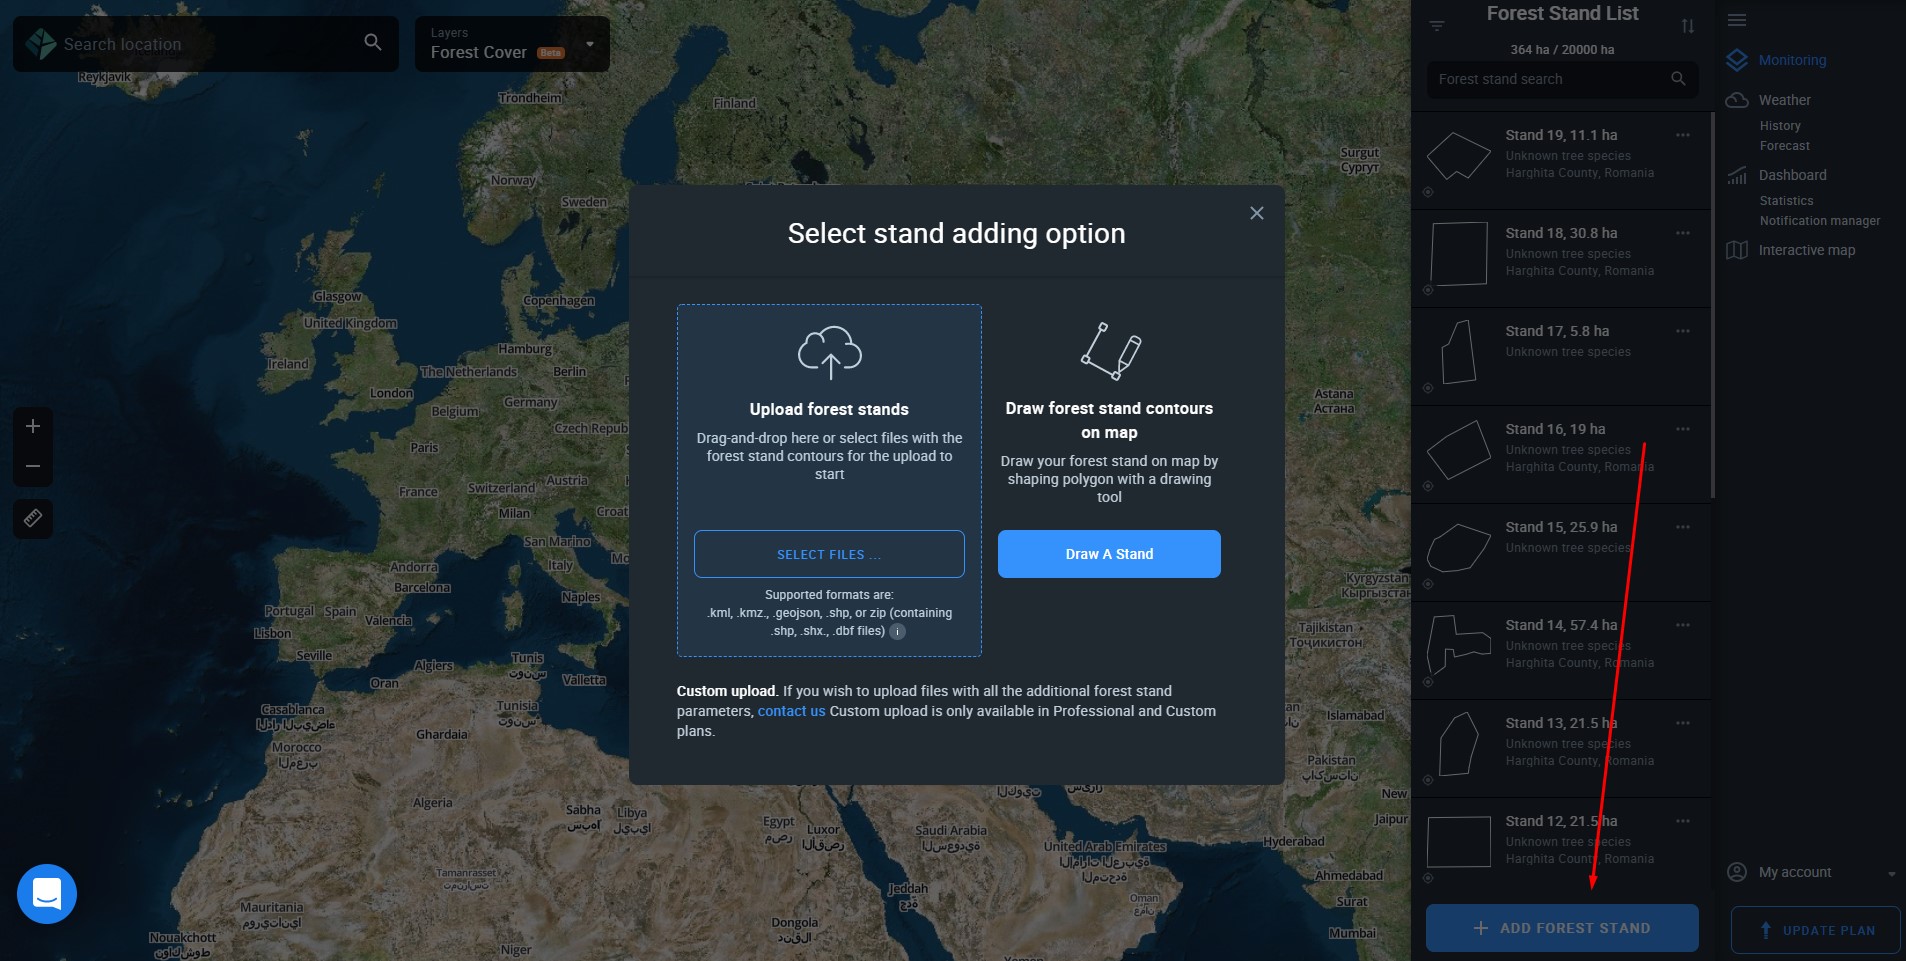
You can add stands in any 1 of 3 simple ways:
- Upload stand(s)
- Draw stand
- Custom upload*
*Contact our sales team
Upload Forest Stands
If you have files containing all the necessary (pre-drawn) forest stand parameters in any of the supported formats (.shp, .kml, .kmz, .geojson.), you can upload them to the EOSDA Forest Monitoring app.
To upload files containing pre-drawn contours of your forest stands, either click on the Add your forest stands box in the list of forest stands (if you don’t have any stands yet) or click +ADD FOREST STAND and then SELECT FILES.
Draw Forest Stand
You can draw the contours of your forest stands on the map simply by using your mouse.
To start drawing a forest stand, click on +ADD FOREST STAND to open the little menu with options, then push the Draw A Stand button.
Step 1. Find your forest stand on the map by entering its location or coordinates in the search bar.
Step 2. Zoom in on the area of the stand and click anywhere on its border to start drawing/outlining the contour.
Step 3. Move your mouse along the stand’s perimeter and click every time you want to set a point. You need your set of points to match the actual borders of the stand on the map. To finish, simply click on the starting point to connect all the points and line segments.
You can edit the drawn contour by click-dragging individual points.
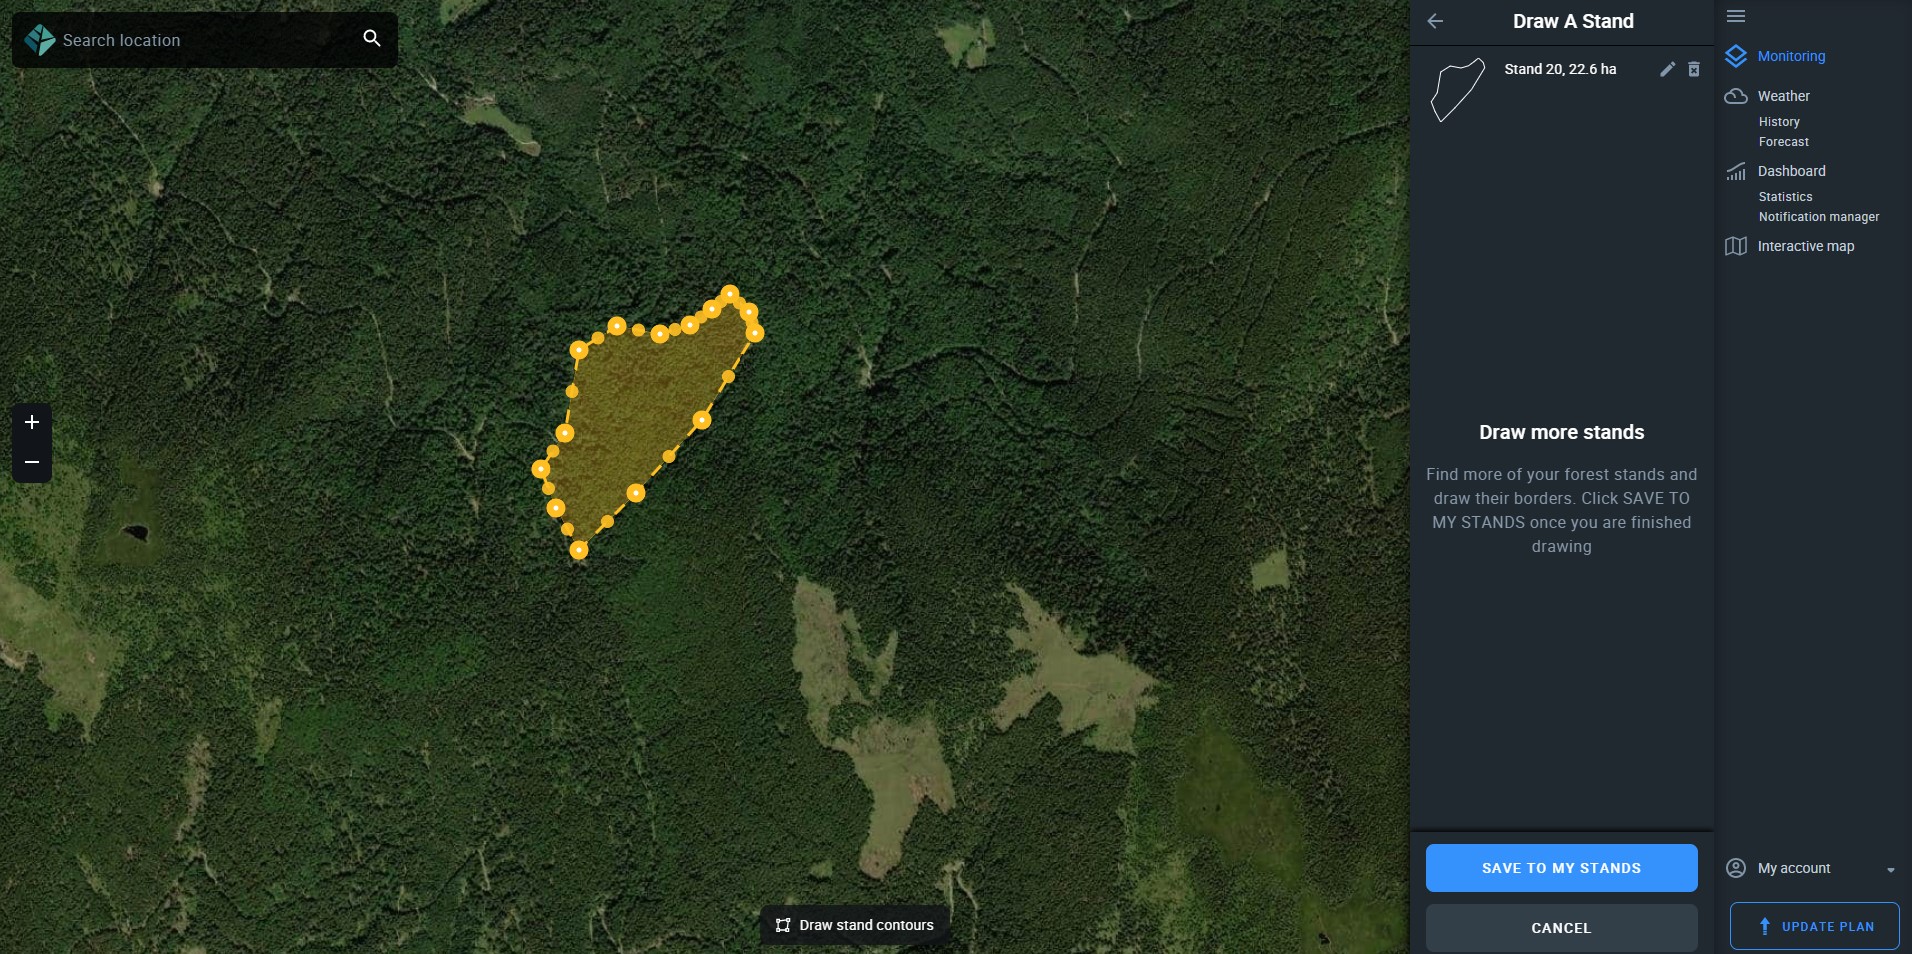
When you think you are done, click SAVE TO MY STANDS and add specific details to distinguish this stand from others, such as
- Forest stand name
- Group name
- Tree species name
- Notes (optional)
Click SAVE to finish adding the newly drawn stand.
Edit Forest Stand
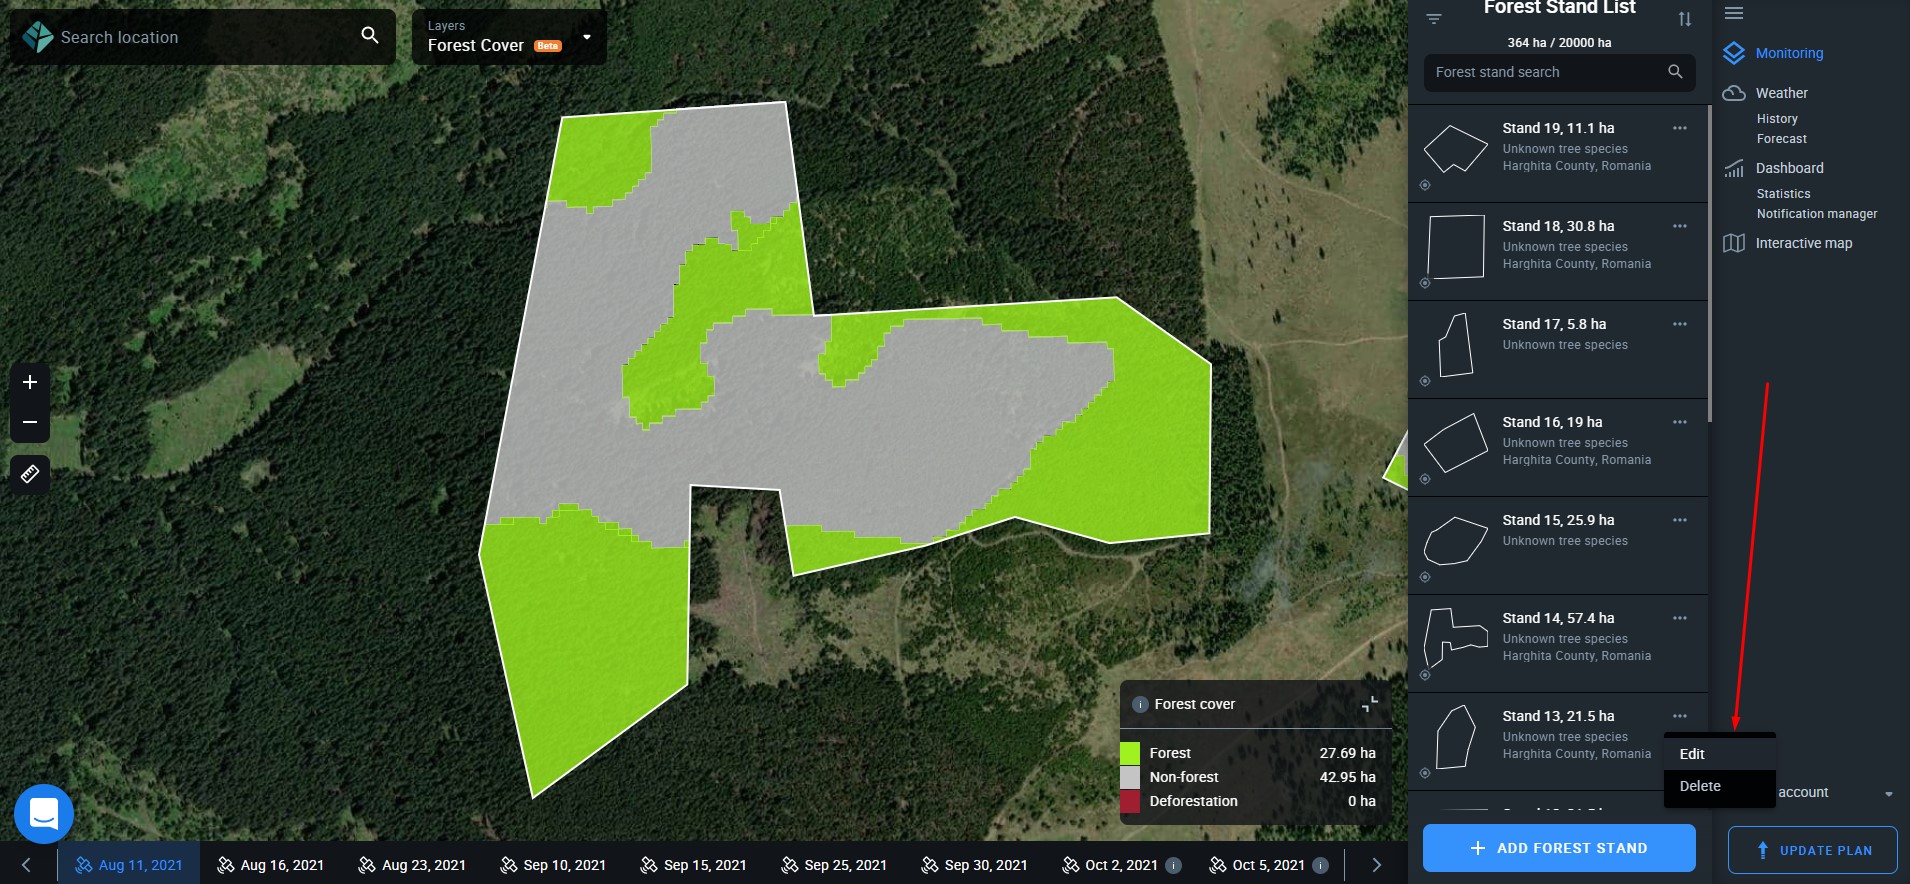
To edit a forest stand, click on the three dots in the stand card and choose Edit. You can also open the stand card and click on the pencil icon in the top right corner.
Stand Card
Every forest stand in the Forest Stand List has a card that displays the most essential information about it:
- Name
- Area
- Tree species
- Location

Forest Stand Search
To quickly find a forest stand in the list of your forest stands, enter its name in the search bar above the Forest Stand List.

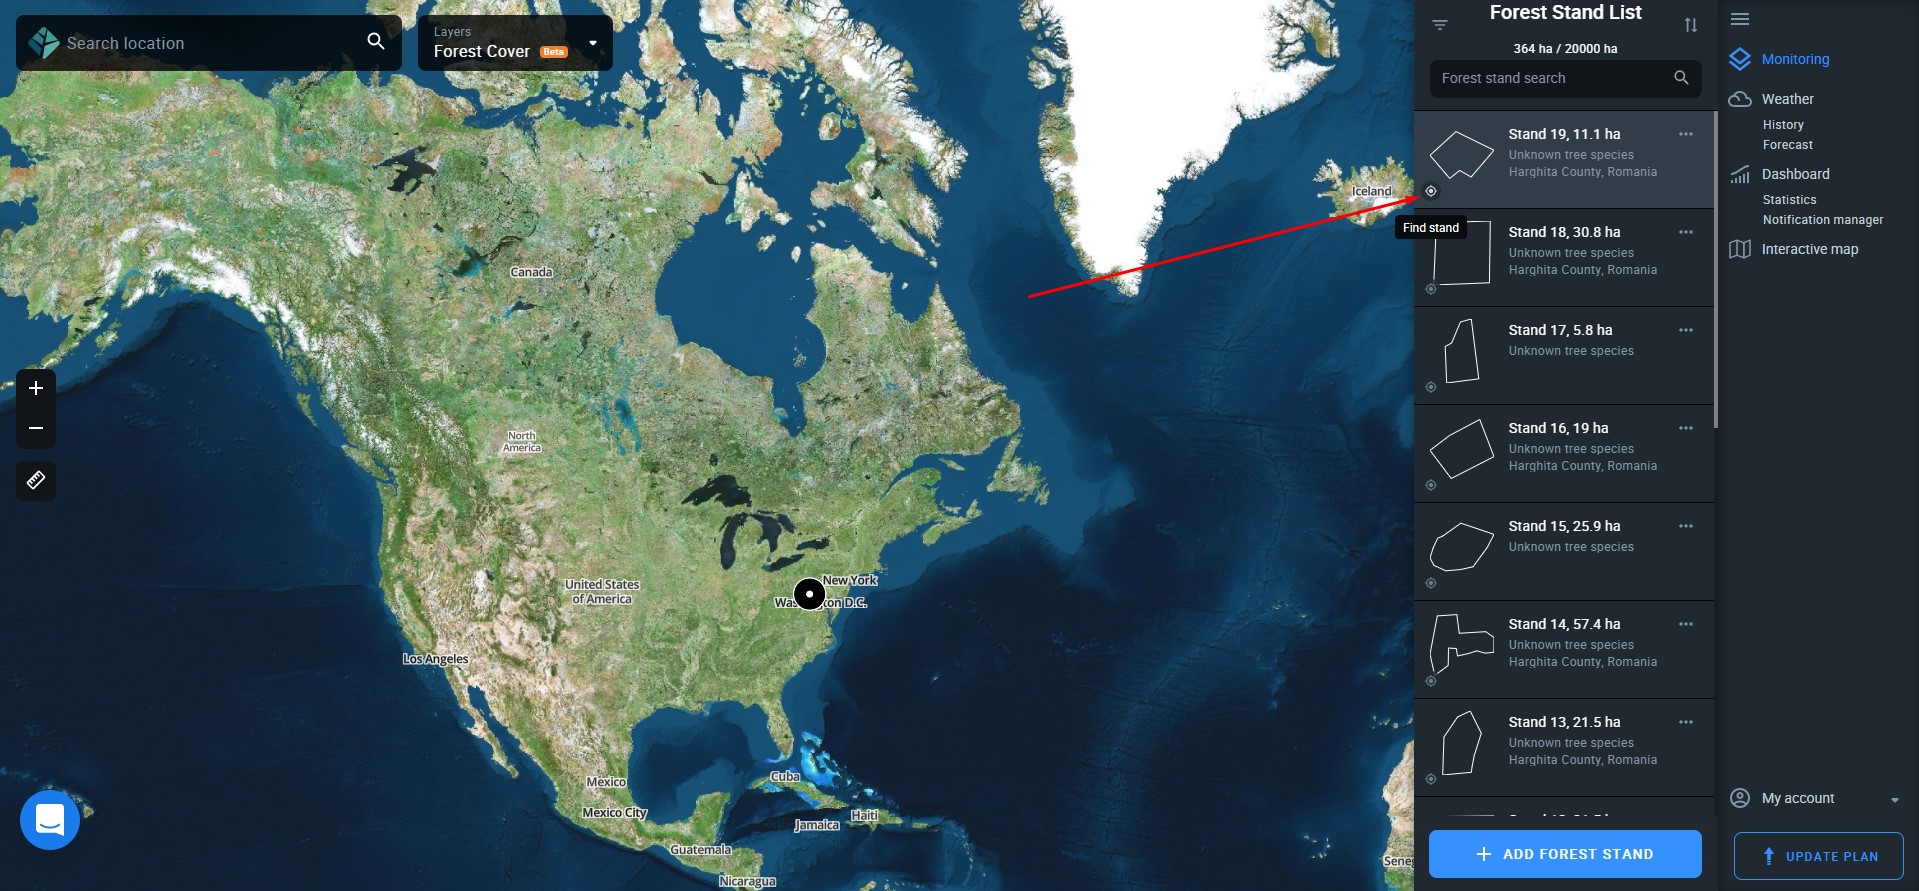
Find Stand
This tool allows you to instantly zoom in on the stand you are looking for regardless of where you currently are on the map.
Filters
Forest stands in the list can be filtered by tree species and/or group names.

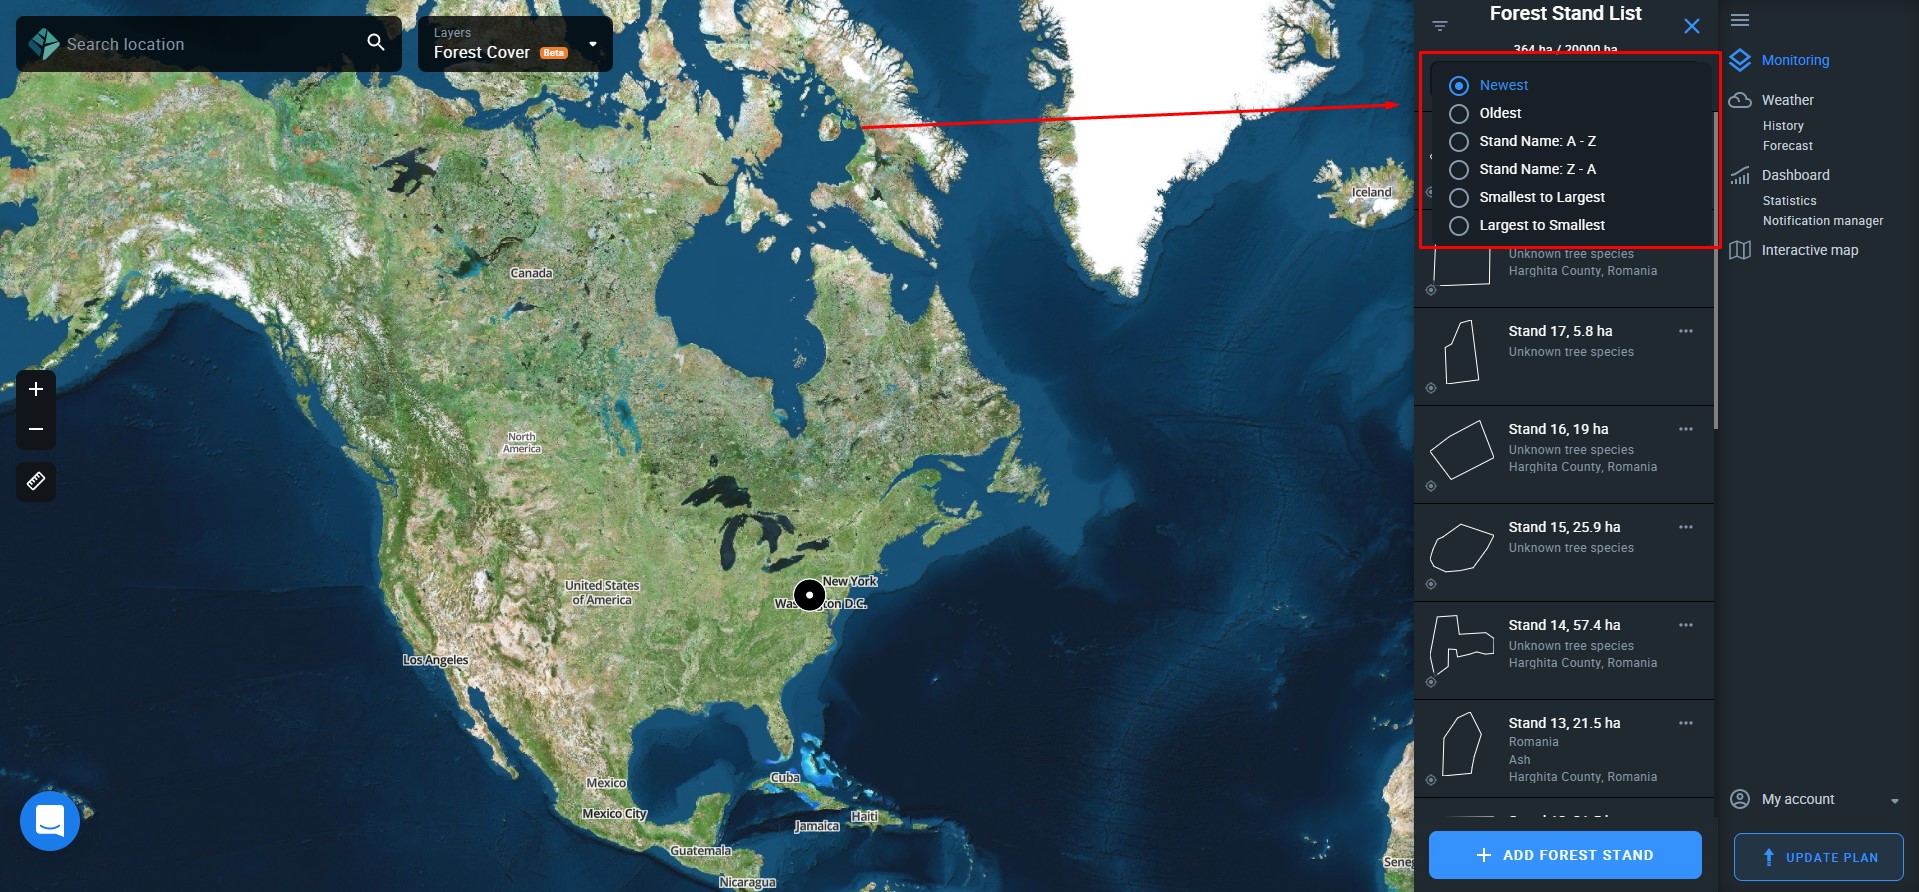
Sorting
The list of forest stands can be sorted by alphabet (A to Z and Z to A), the date the stand was added (oldest to newest/newest to oldest), and the stand’s area (largest to smallest/smallest to largest).
Pricing & Access
A section with the map and global layers for monitoring different attributes of your forest stands, such as forest cover, deforestation, thermal anomalies, and more.
Working With The Map
We’re using a base map to visualize geographic information and overlay data from layers*.
*To view the latest images of a forest stand, select the stand from the list and open it.
You will find all of the tools for working with the map on the left-hand side.
- Zoom in/out
- Measure distance
You can move/pan the map by clicking and holding the left mouse button.

Zoom (+/-)
To zoom in or out, either scroll the mouse wheel up or down or click the plus and minus icons (+/-) on the left-hand side of the map.
Measure Distance, Perimeter, And Area
Distance
This tool is great for measuring the exact distance between two or more points on the map.
It is done in 3 simple steps:
Step 1. Left-click on the measure distance icon.
Step 2. Place the starting point on the map with a single click.
Step 3. Place the second point on the map. A straight line will automatically connect the two points.
Step 4. Keep placing points until you’ve measured the total distance and left-click on the final point*.
The total distance will be displayed in the lower portion of the screen.
*You can continue placing points indefinitely. All the distances will add up to a total number.
Perimeter & Area
To measure the perimeter and area of a polygon on the map, follow these simple steps:
Step 1. Place the first point on the map with a single left click.
Step 2. Place several more points to create a polygon.
Step 3. Click on the final point.
The total perimeter and area will be displayed in the lower portion of the screen.
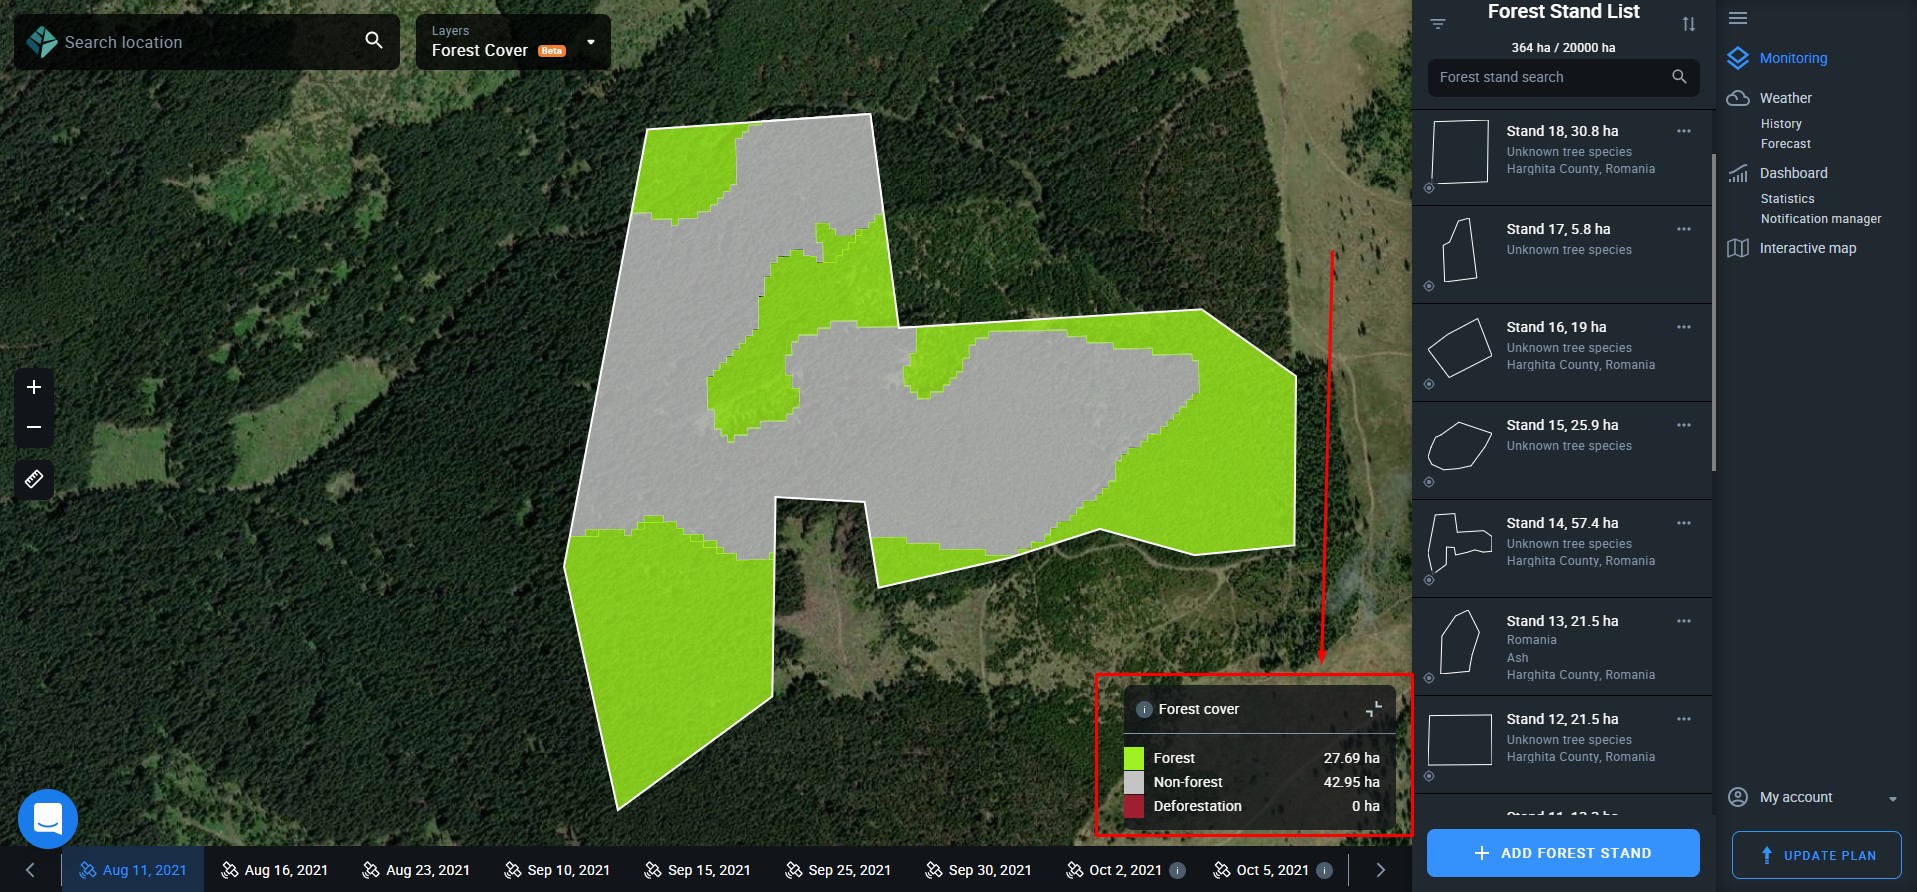
Legend
Data of most layers (except Thermal Anomalies) will be displayed as a legend in the bottom right corner of the map. To hide the legend, click on the “expand” icon.
In the Individual stand monitoring mode, the legend will also contain three icons:
- Show satellite image
- Download arrow
- Percentage
By clicking on “show satellite image”, you can switch to a true-color view of your stand.
To download a layer, click on the arrow.
Clicking on the “percentage” icon changes the area value from hectares/acres to percentage.
In this mode, the layers feature allows you to visualize and analyze different data attributes of multiple forest stands at once. Using a drop-down menu in the upper portion of the screen, you can choose between one of the available layers:
- Forest Cover
- Deforestation
- Thermal Anomalies
- Water Stress
- Interactive Map
To view two or more stands in a layer, find one of them using the “Find stand” tool. It is important that these stands are located relatively close to one another, within the same area.
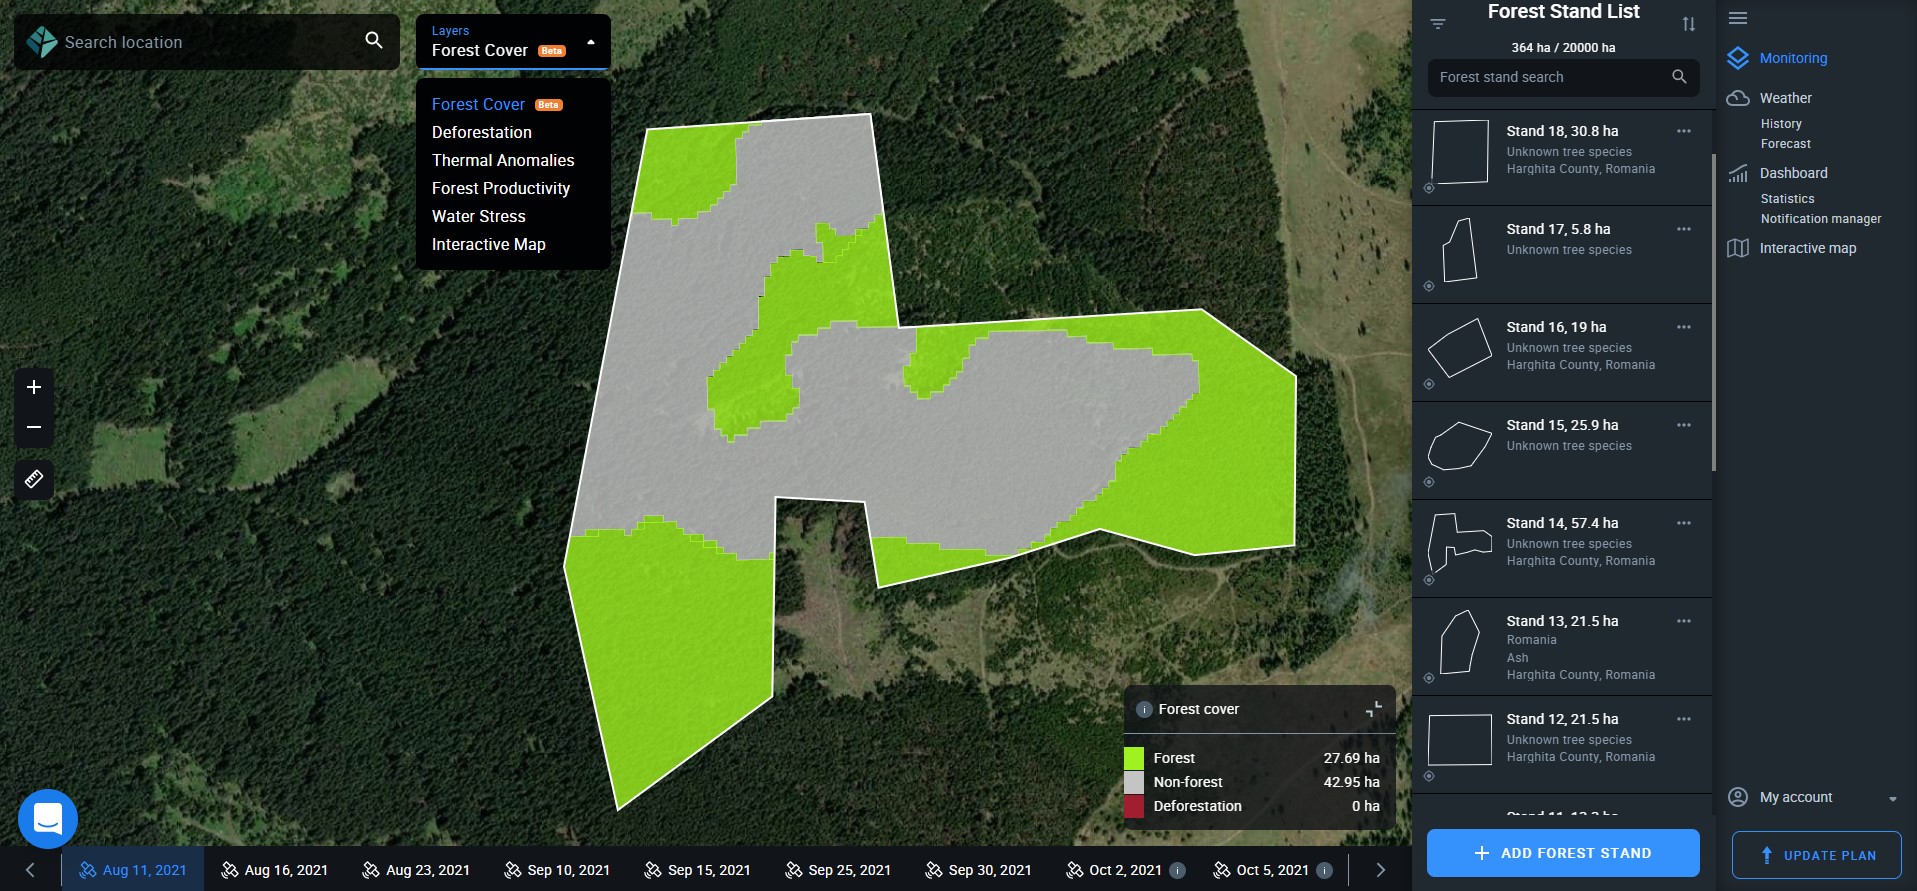
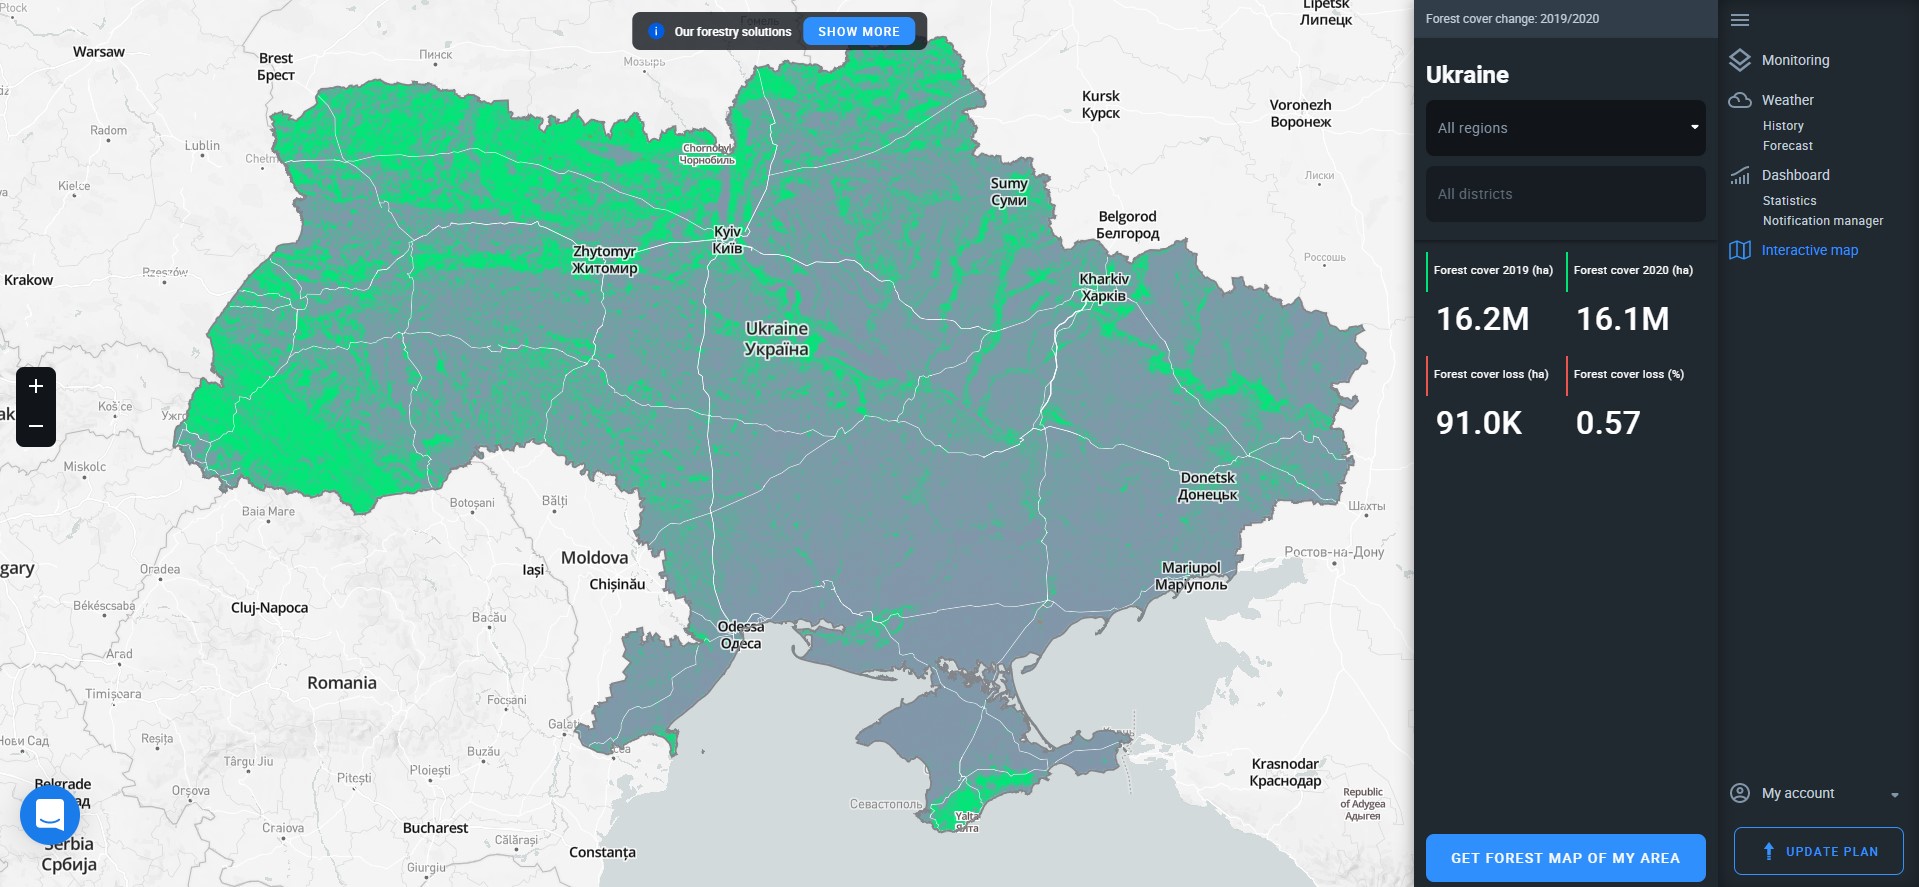
Forest Cover
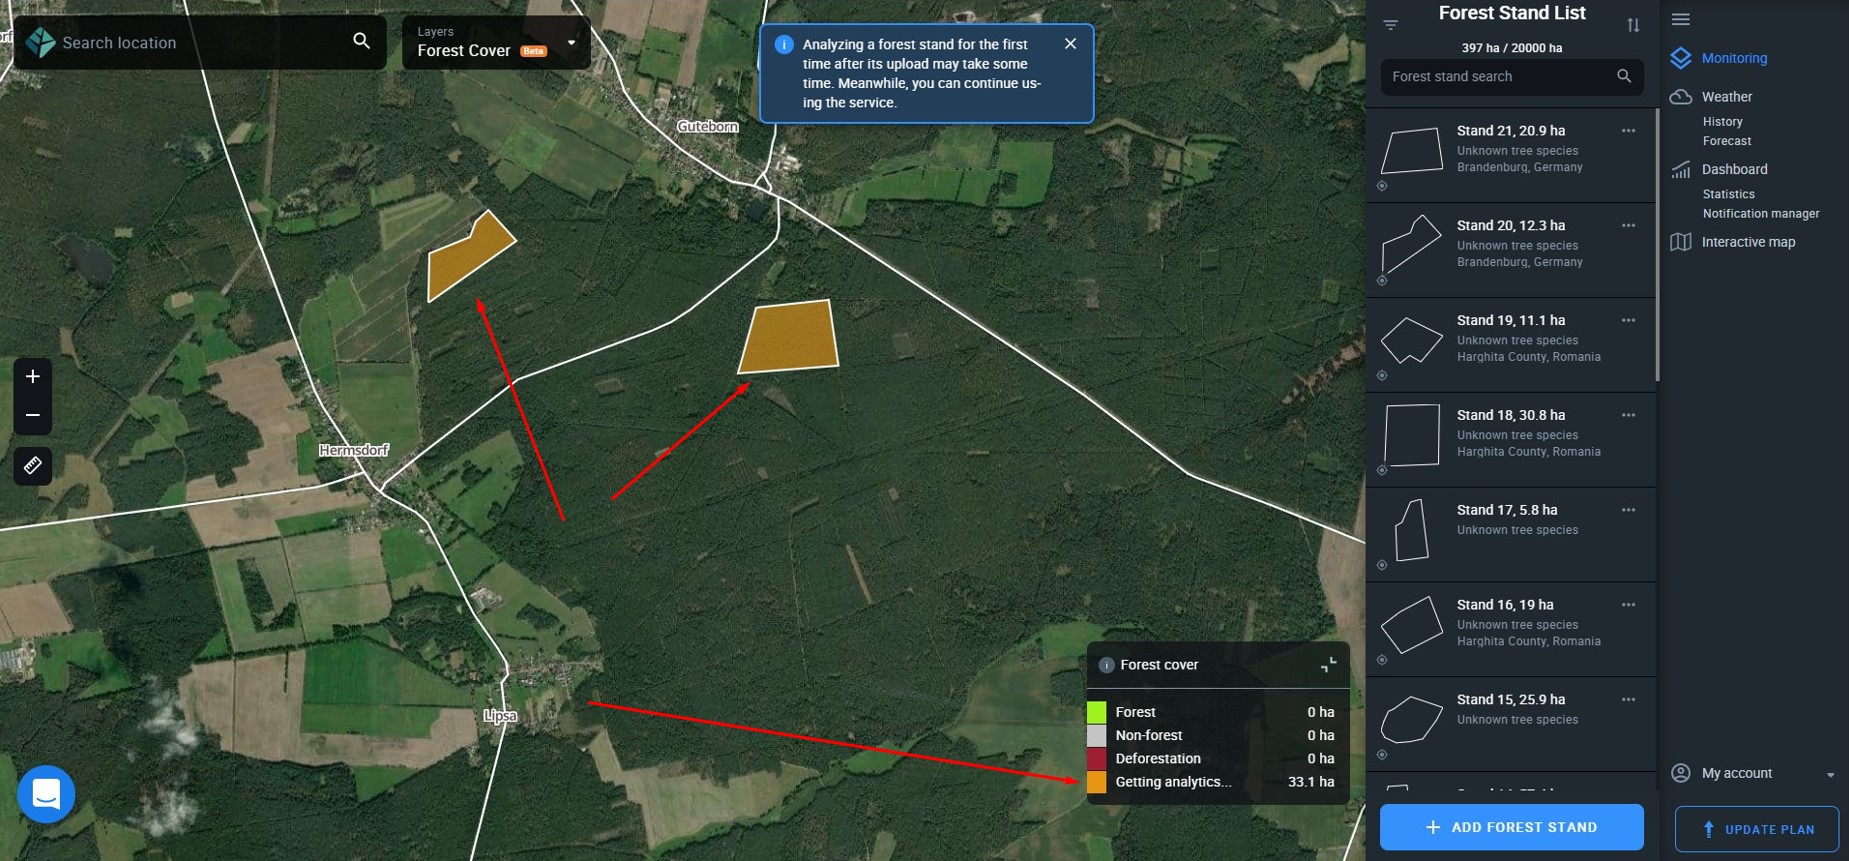
This layer tells you how much of a stand was covered with the forest at the time of a satellite image. The bright green areas represent the forest cover itself, while the gray area stands for anything that is non-forest.
Note that calculating data can take some time. During this time, the area of the stand(s) will appear orange.
By hovering your mouse over this layer (or double-tapping on a mobile device), you’ll be able to view several parameters at once:
- total area of forest cover in hectares or acres;
- percentage of forest cover relative to the total stand area;
- date when this amount of forest cover was detected/present.
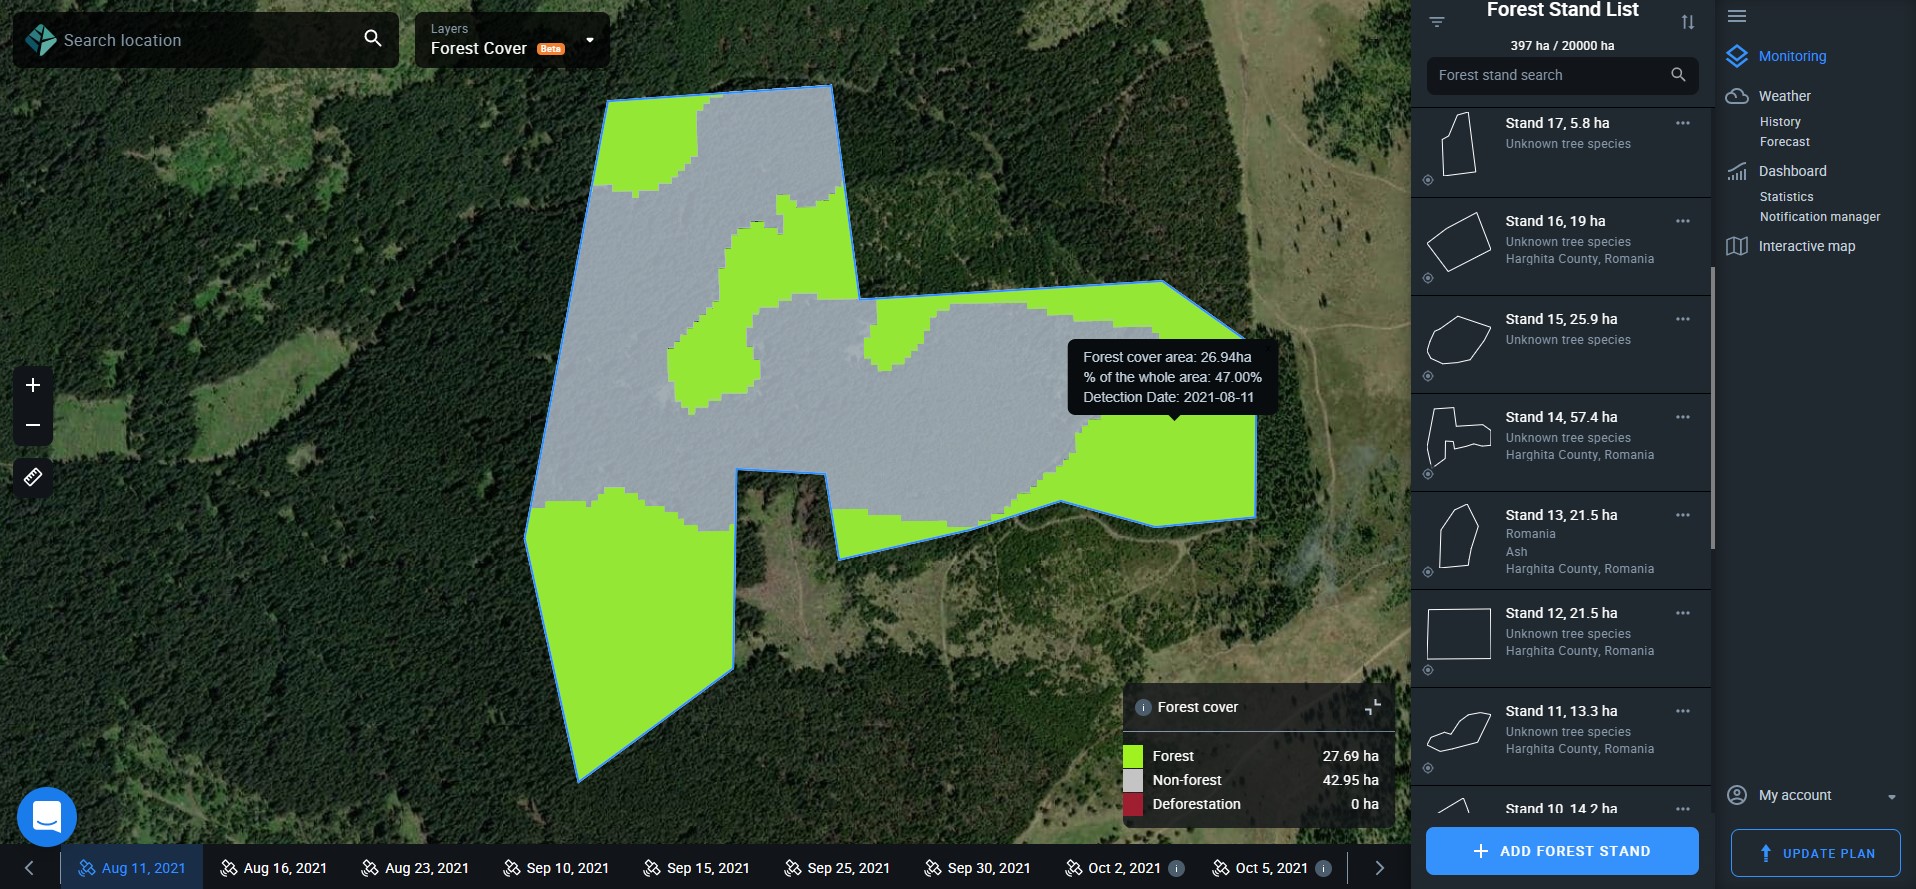
Similarly, hovering or double-tapping over the gray area, you’ll learn the size (ha/ac) and the percentile (%) equivalent of the non-forest part.
For example:
- Forest cover area: 134.19 ha.
- % of the whole area: 72.80%
- Detection date: 26.08.2021
You can also view the hectares/acres of forest cover and no-forest areas in the legend.
Important: if the vegetation season for the stand(s) is over, the system will automatically select to display the data based on the last available image before the leaves have fallen. This is done to provide you with the most accurate data.

Deforestation
Switching to this layer, you see the extent of deforestation within your stand, measured in hectares or acres (logging, natural changes in forest cover, loss of forest cover due to any other cause) for a selected period. Deforested areas appear red both on the layer and in the legend, while “other” might stand either for no deforestation or non-forest.
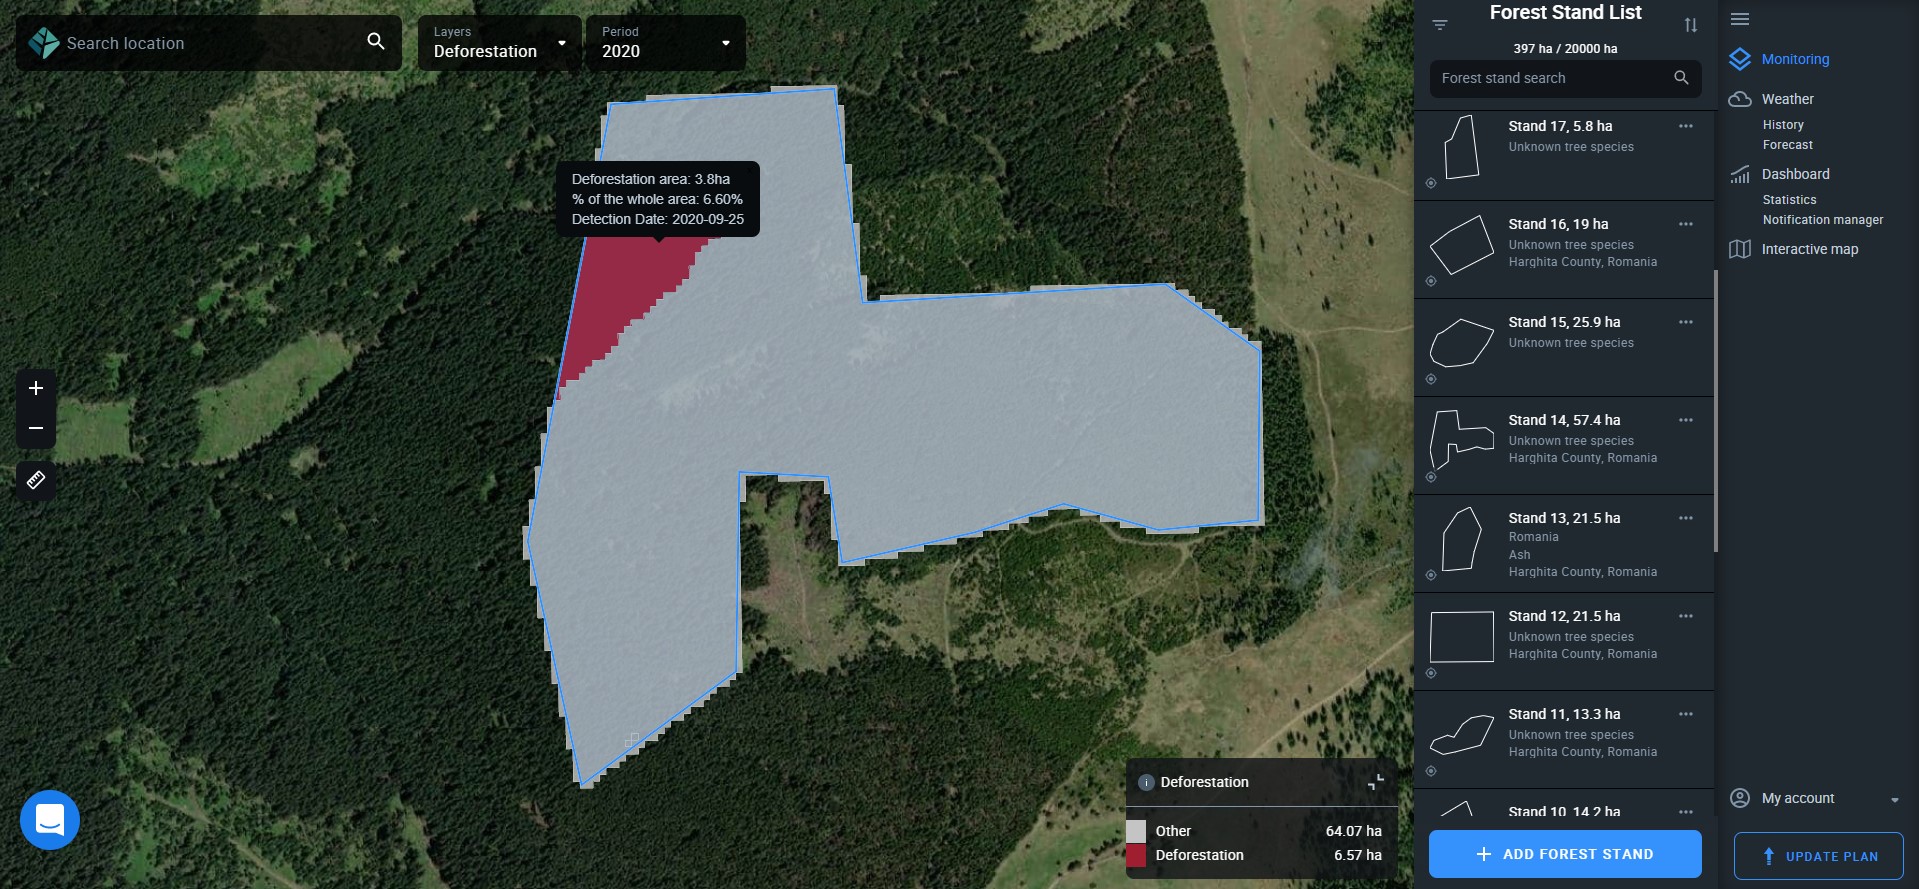
Note that calculating data can take some time. During this time, the area of the stand(s) will appear orange. If there are no available cloudless images for the selected period, the area of the stand(s) will appear blue on the map.
By hovering over or double-tapping (on a mobile device) the red areas, you’ll be able to view the key parameters:
- total deforested area;
- percentage of deforested area relative to the total stand area;
- date when this amount of deforestation was detected.
Similarly, hovering or double-tapping over the gray area, you’ll learn the size (ha/ac) and the percentile (%) equivalent of the no-deforestation/non-forest part.
For example:
Other: 180.5 ha.
% of the whole area: 97.90%
Detection date: 26.08.2021
You can also view the hectares/acres of forest cover and no-forest areas in the legend.
Important: if the vegetation season for the stand(s) is over, the system will automatically select to display the data based on the last available image before the leaves have fallen. This is done to provide you with the most accurate data.

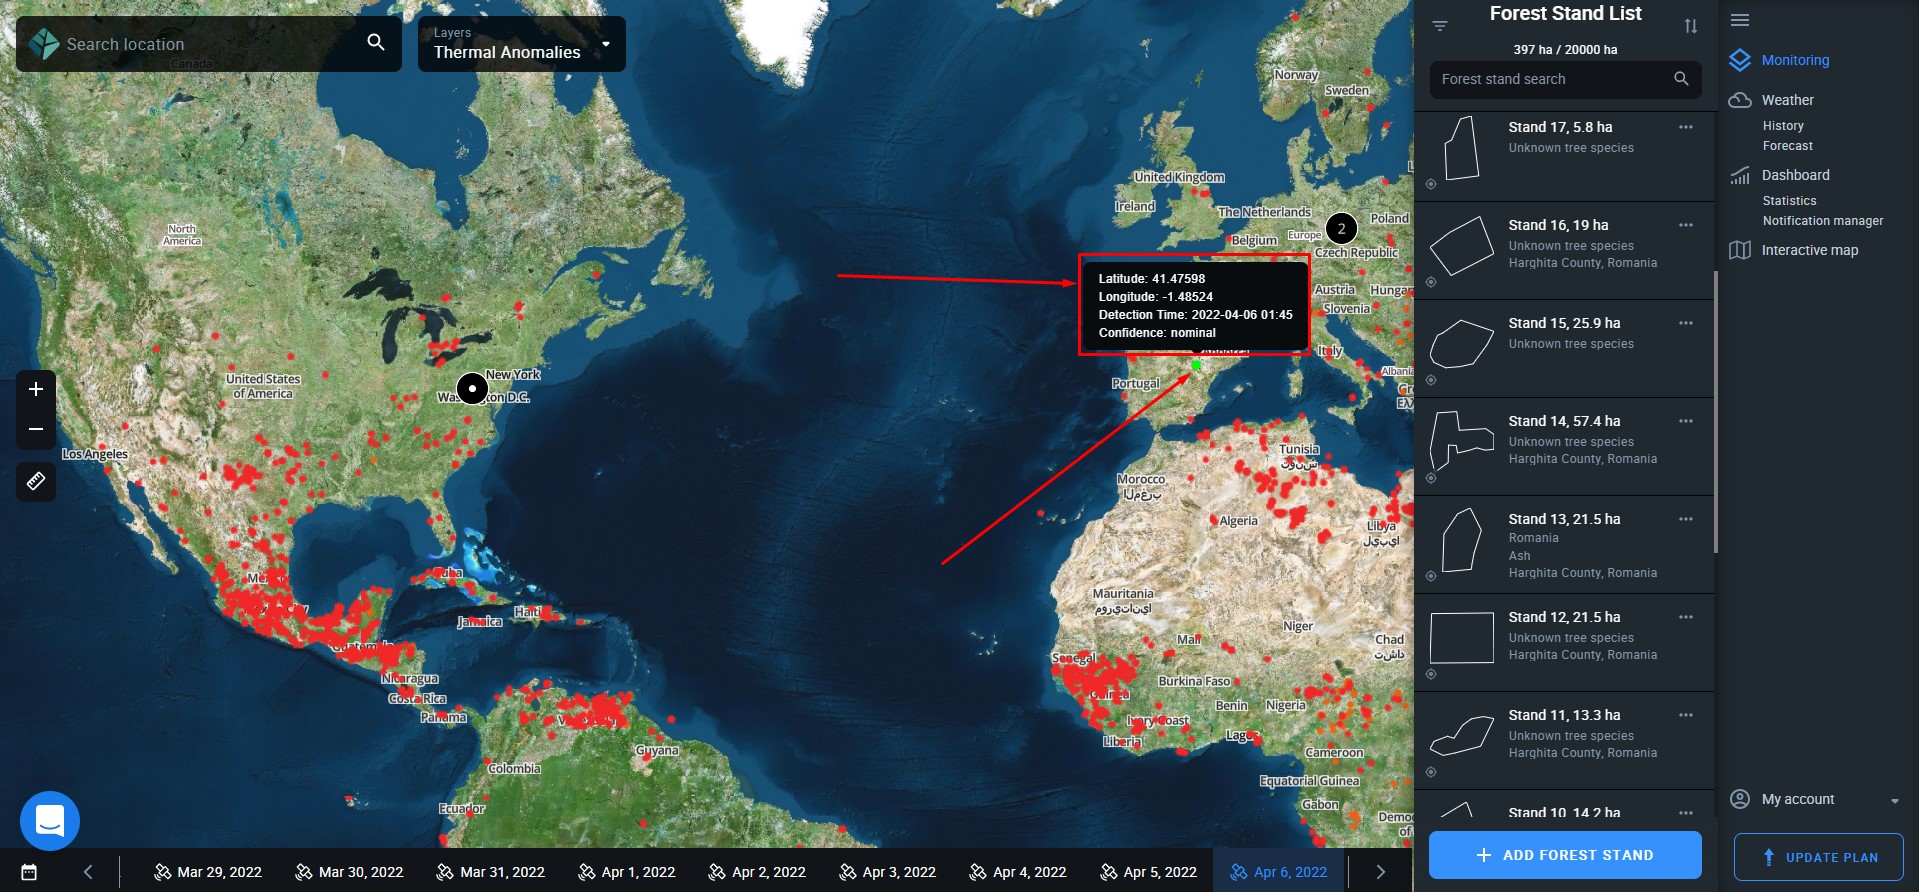
Thermal Anomalies
Our global map of heatwaves is based on NASA’s Fire Information for Resource Management System (FIRMS). Every red dot may indicate a potential fire risk, among other things. The map is constantly updated.
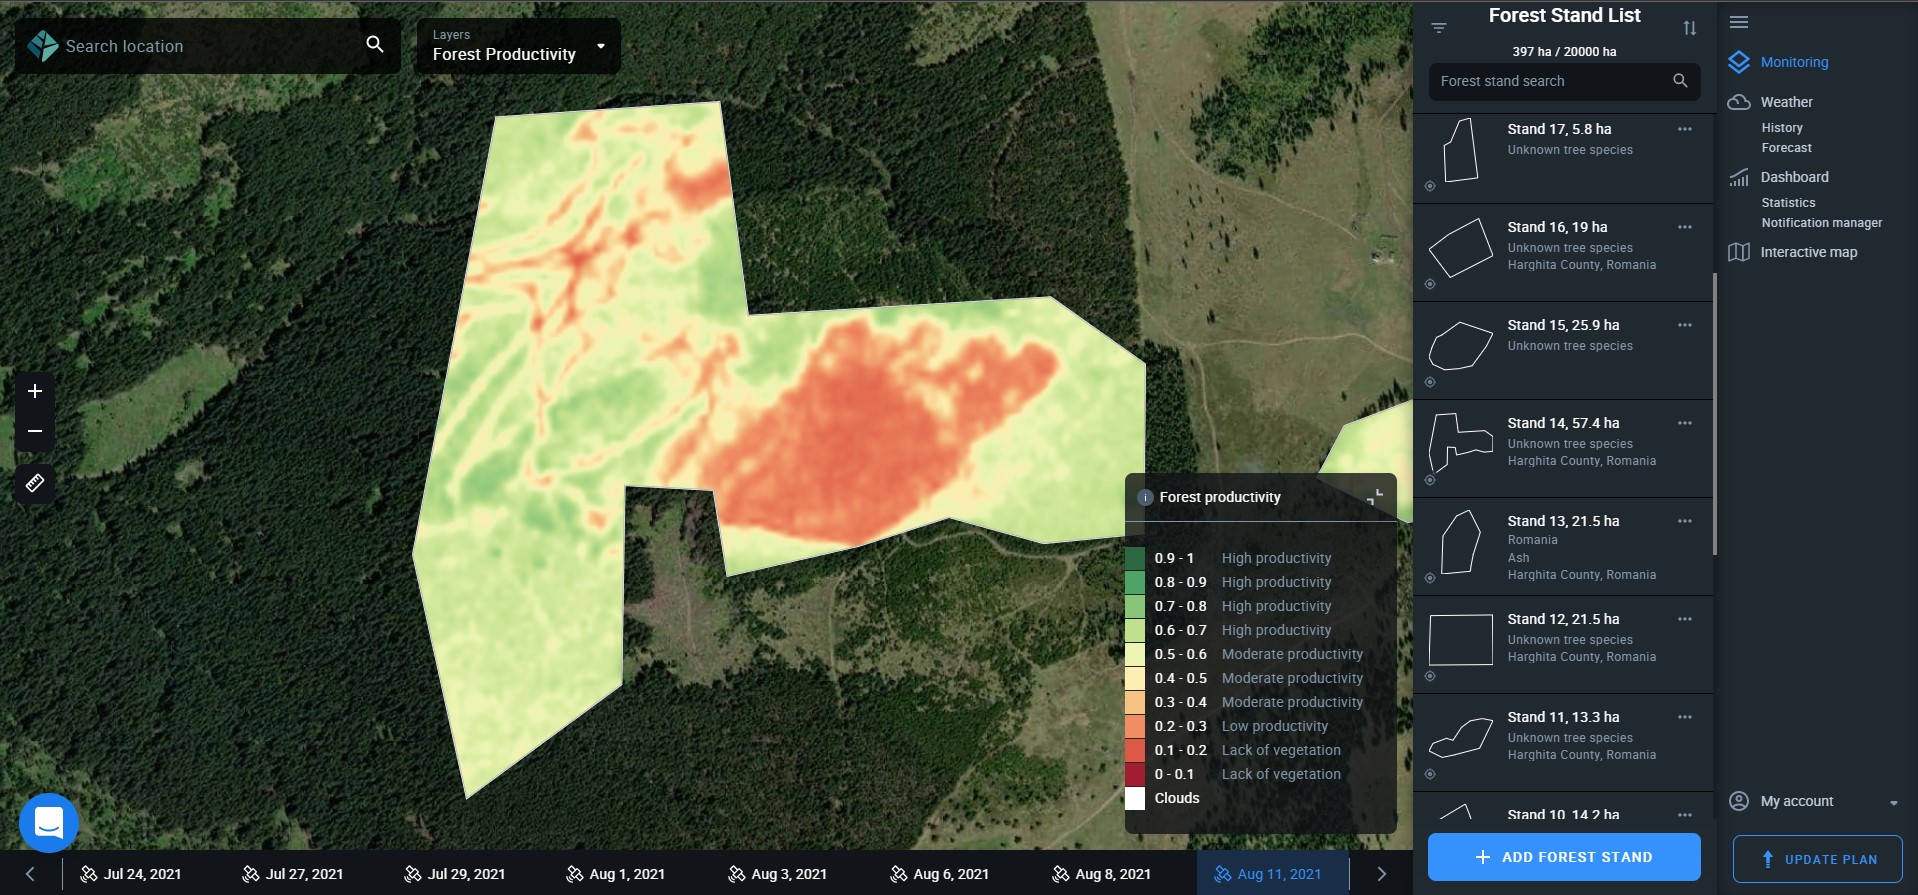
Forest Productivity
Using this layer, you can track any changes in the health of trees within your stand on a regular basis. High productivity indicates healthy trees, while low productivity signals damage due to diseases, natural disasters, pest infestations, human activities, end of the vegetation period, and other causes. Unproductive forest may indicate either a complete absence of vegetation within the stand or recently felled trees.
Productivity/health is measured by calculating a vegetation index that ranges from -1 (very poor health) to +1 (healthy). The process is completely automated and ongoing. Values are visualized as color hues ranging from red (-1, unproductive) to green (+1, high productivity), red to orange to yellow to green. There are subranges within the total range: e.g. 0.2 – 0.3 (saturated orange) represent low productivity. This information is contained within the legend.
Tip: Use forest productivity values to measure the effectiveness of forestry operations soon after their completion.
Water Stress
Water stress is calculated as an index ranging from 0 (high water stress, drought conditions) to 1 (waterlogging). Ideal conditions of “no water stress” are represented by the range of 0.4 to 0.8. This range appears as pinkish and violet hues on your map. Brownish hues indicate high water stress related to dry conditions within the stand, and dark bluish hues are indicators of waterlogging. White merely stands for clouds.
The legend tells you exactly how the hues on the map correlate with the values of the water stress index.

Interactive Map
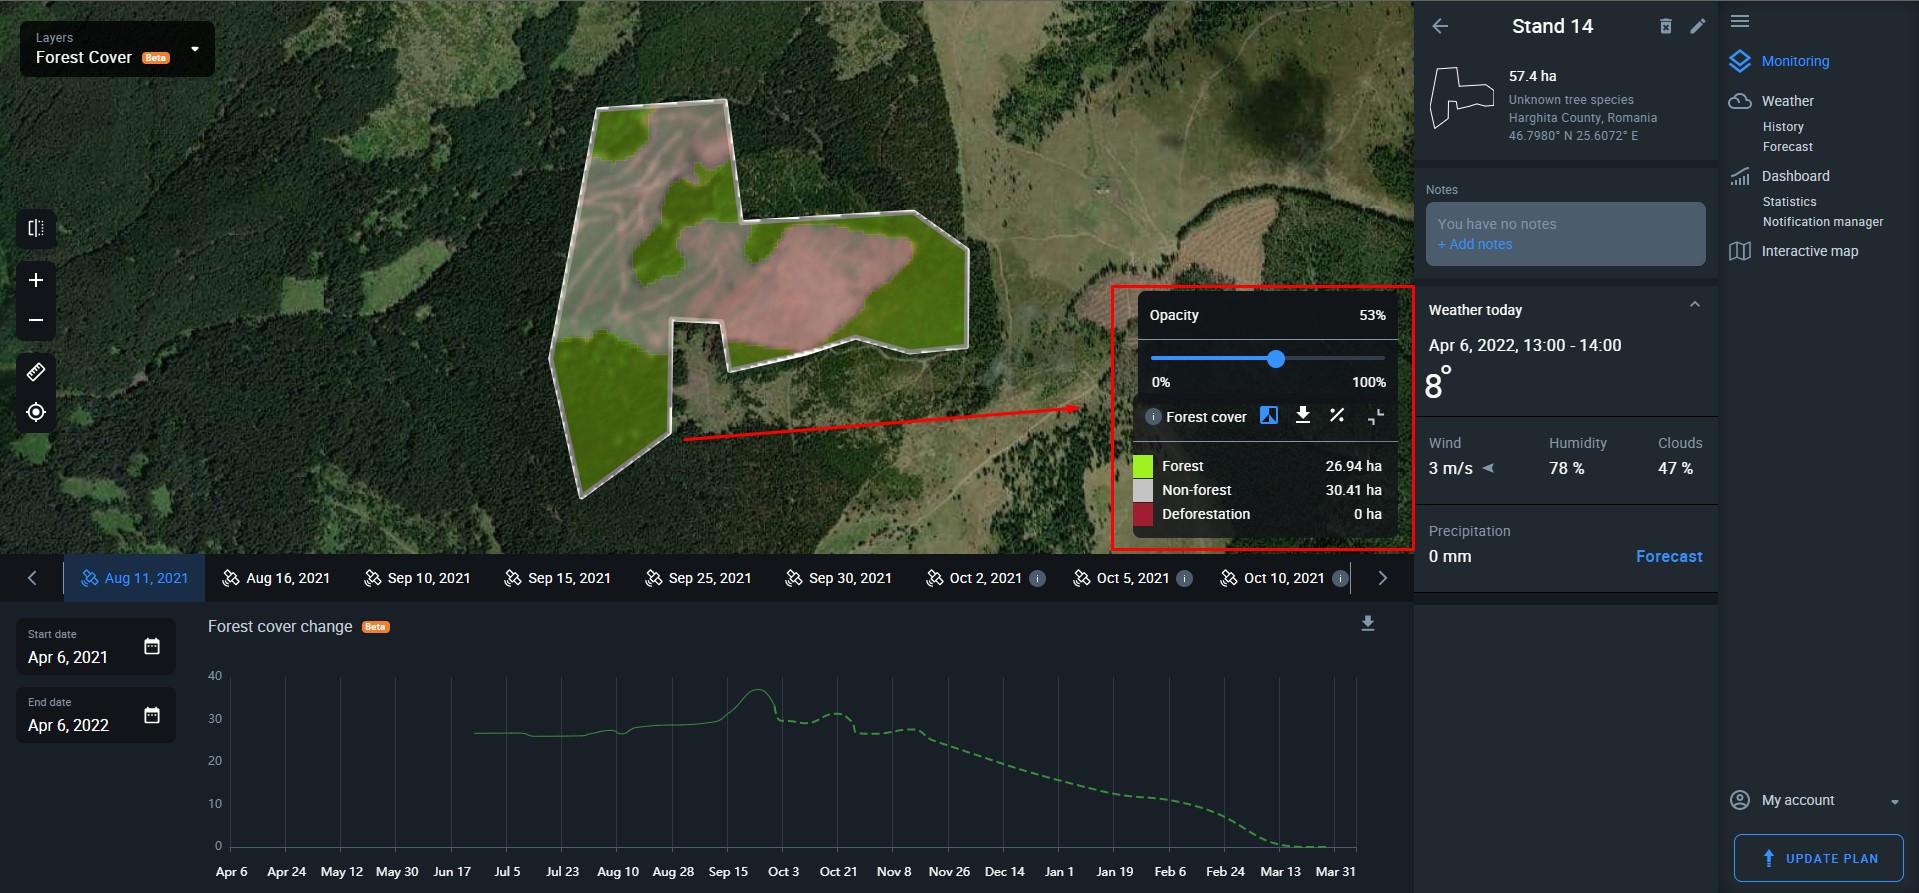
This mode allows you to view more data for a particular stand, including current weather conditions in the area, historical data on the graph below, and notes that you have added previously.
To enter the individual stand monitoring mode, select a particular forest stand from your list and open it. The upper portion of the screen displays your stand on the map in a default layer, while the lower portion of the screen shows you the analytics for the stand. Switch between different layers to view different parameters/features both on the map and on the graph below.
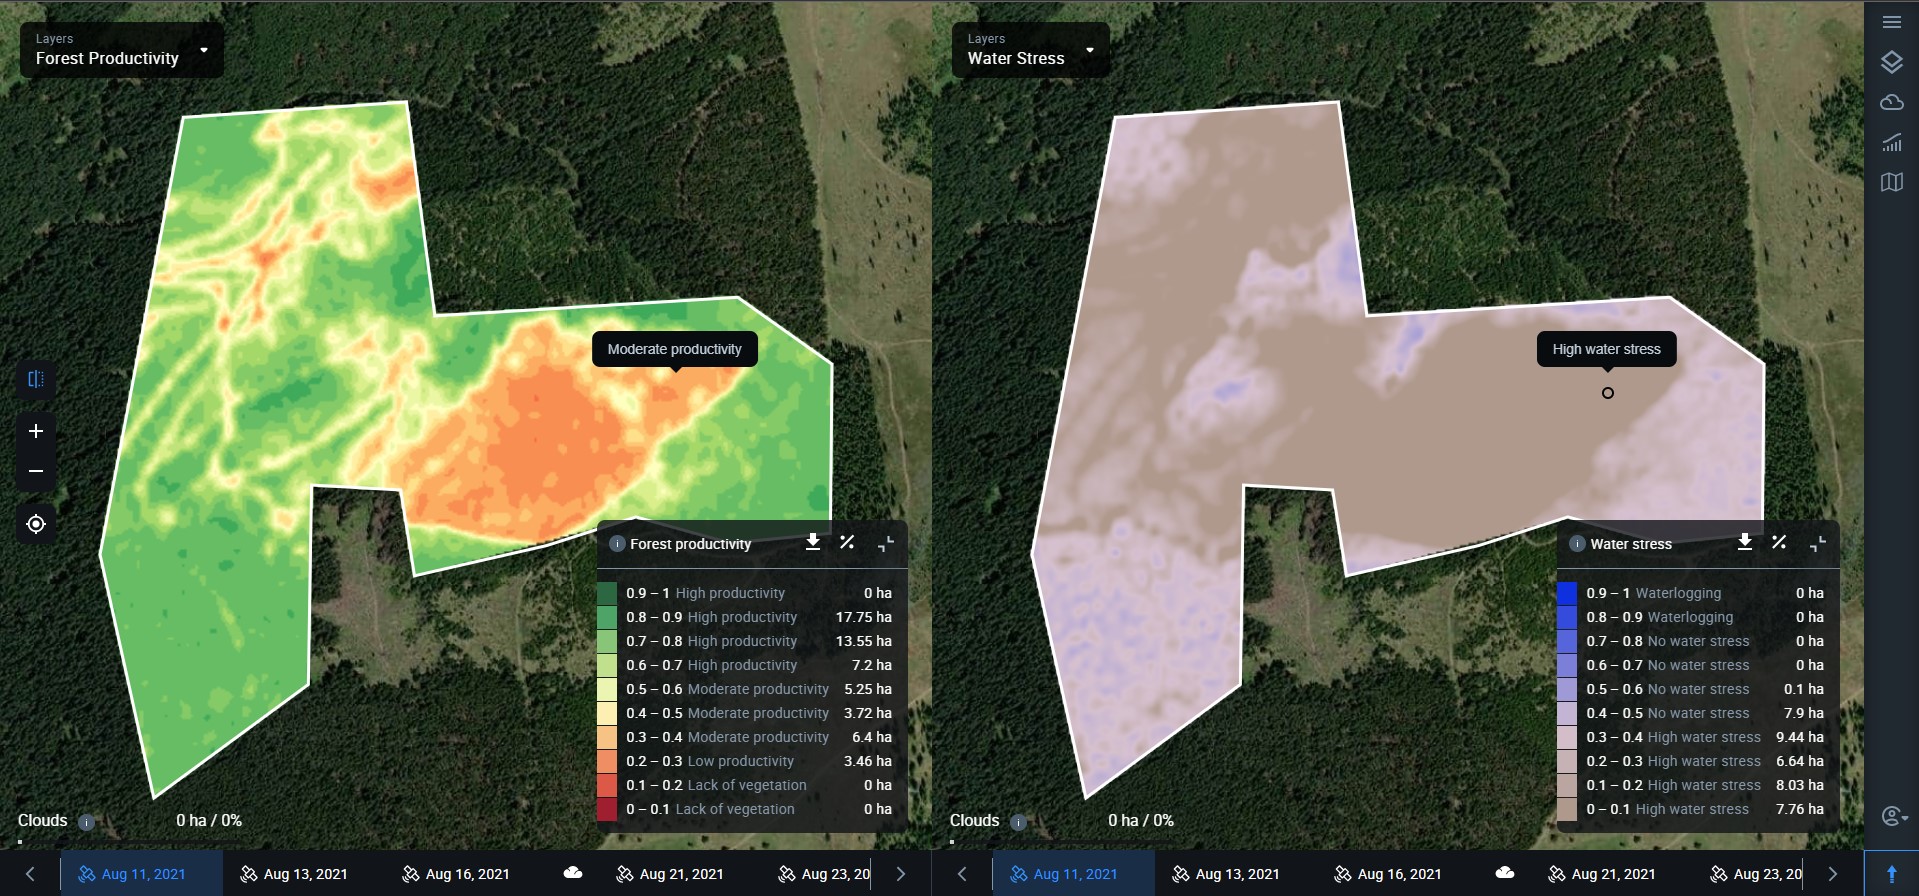
Split View
By clicking on this icon, you’ll be able to split the screen into left and right halves to compare different parameters of the same stand.
You can compare different layers for the same date or different dates of the same stand. For example, you can simultaneously view the extent of deforestation and the water levels within the same stand for the same date. Or you can compare the forest cover of the same stand for different dates.
Forest Cover
This layer tells you how much of a stand was covered with the forest at the time of a satellite image. The bright green areas represent the forest cover itself, while the gray area stands for anything that is non-forest.
Note that calculating data can take some time. During this time, the area of the stand will appear orange.
You can alternate between the layer and the true-color satellite image of the stand by clicking on the “show satellite image” icon in the little menu box to the right.
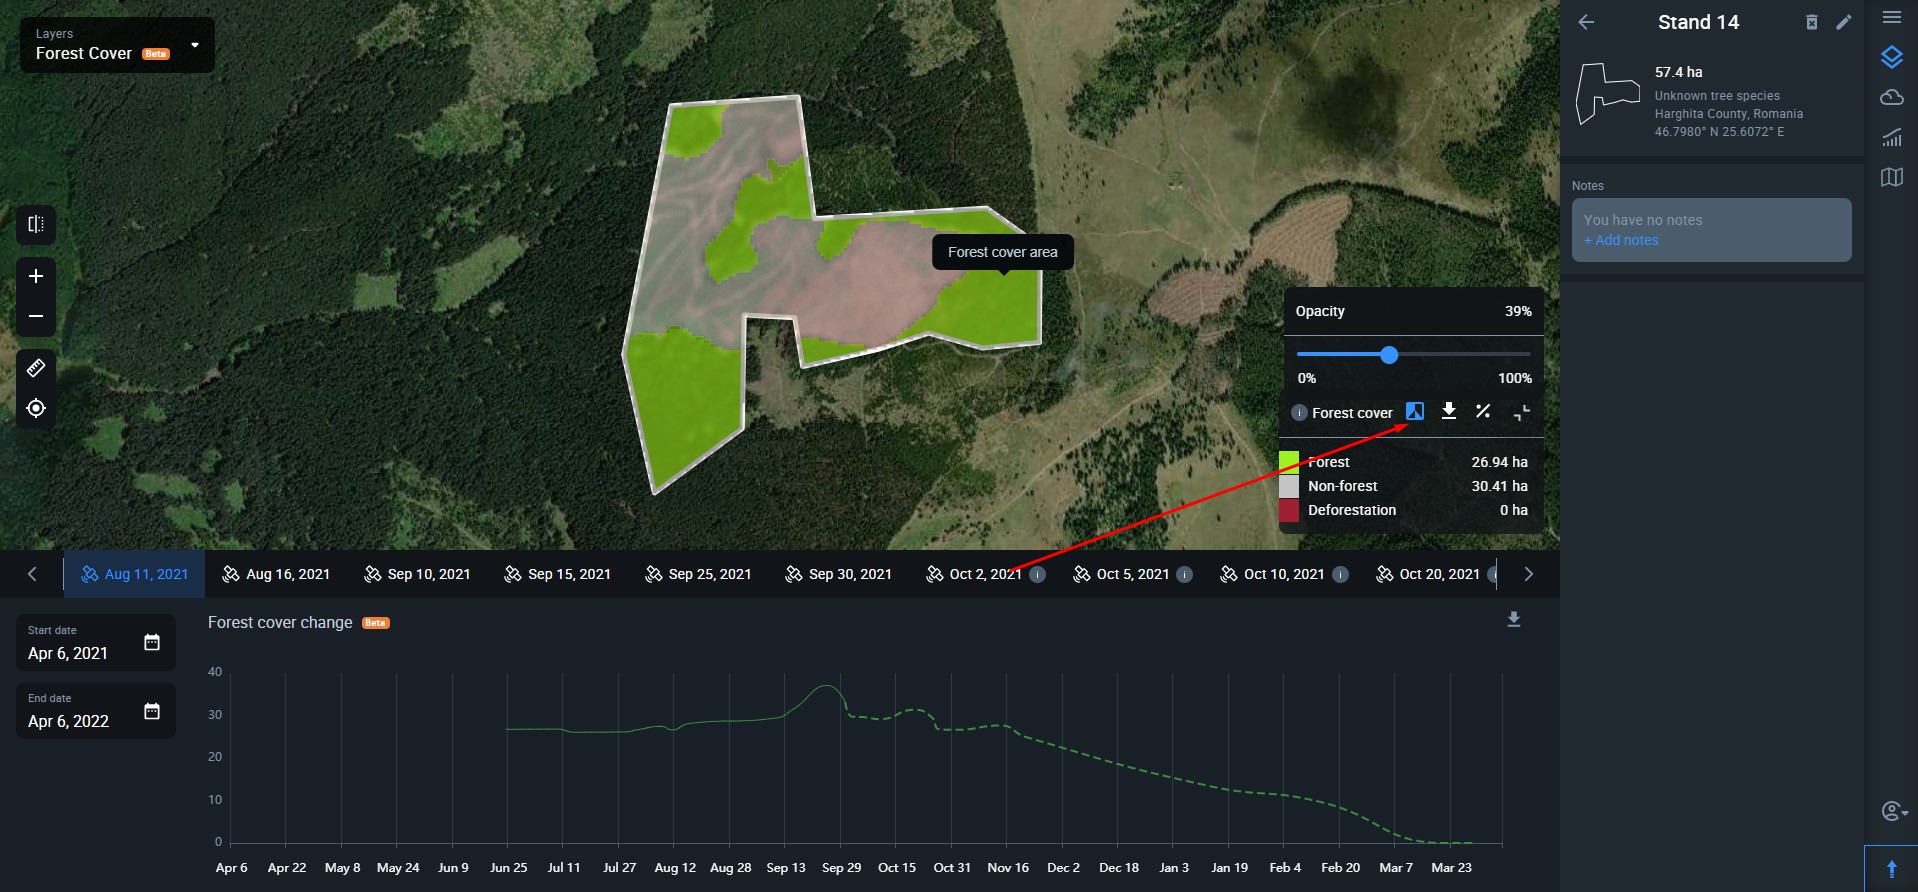
To download the forest layer map of your stand, simply click on the arrow icon.
By clicking the percentage icon, you’ll see how much percent of forest cover area and non-forest area are within the stand.
To hide the menu box, click the “expand” icon.
Important: if the vegetation season for the stand is over, the system will automatically select to display the data based on the last available image before the leaves have fallen. This is done to provide you with the most accurate data.
Deforestation
Switching to this layer, you see the extent of deforestation (logging, natural changes in forest cover, loss of forest cover due to any other cause) for a selected period within your stand in hectares or acres. Deforested areas appear red both on the layer and in the legend, while “other” might stand either for no deforestation or non-forest.
Note that calculating data can take some time. During this time, the area of the stand(s) will appear orange. If there are no available cloudless images for the selected period, the area of the stand(s) will appear blue on the map.
You can choose between three* types of periods to view deforestation:
- Month (from the available cloudless image nearest to the first date of the selected month till the available cloudless image nearest to the first date of the next month);
- Quarter (from the available cloudless image nearest to the first date of the first month in the quarter till the available cloudless image nearest to the first date of the first month in the next quarter);
- Year** (from the available cloudless image nearest to 1 January of the selected year till the available cloudless image nearest to 1 January of the next year).
*To select a custom period, contact our Sales Team
**Since winter occurs not simultaneously for different latitudes, we measure annual deforestation within the growing season of the tree species
To compare the deforestation layer map with the naked-eye image of the stand, click on the “show satellite image” icon.

Download the deforestation layer map of your stand by clicking on the arrow icon.
A click on the percentage icon will show you the deforested area percentage relative to the total area of the stand. For example, 2%.
To hide the menu box, click the “expand” icon.
Set up notifications
Once you’ve selected the period to track deforestation, you can set up notifications.
Important: if the vegetation season for the stand is over, the system will automatically select to display the data based on the last available image before the leaves have fallen. This is done to provide you with the most accurate data.
Forest Productivity
Using this layer, you can track any changes in the health of trees within your stand on a regular basis. High productivity indicates healthy trees, while low productivity signals damage due to diseases, natural disasters, pest infestations, human activities, and other causes. Unproductive forest may indicate either a complete absence of vegetation within the stand or recently felled trees.
The graph in the lower portion of the screen shows you the history of this stand’s productivity as a green curve, as well as maximum (red) and minimum (blue) temperatures.
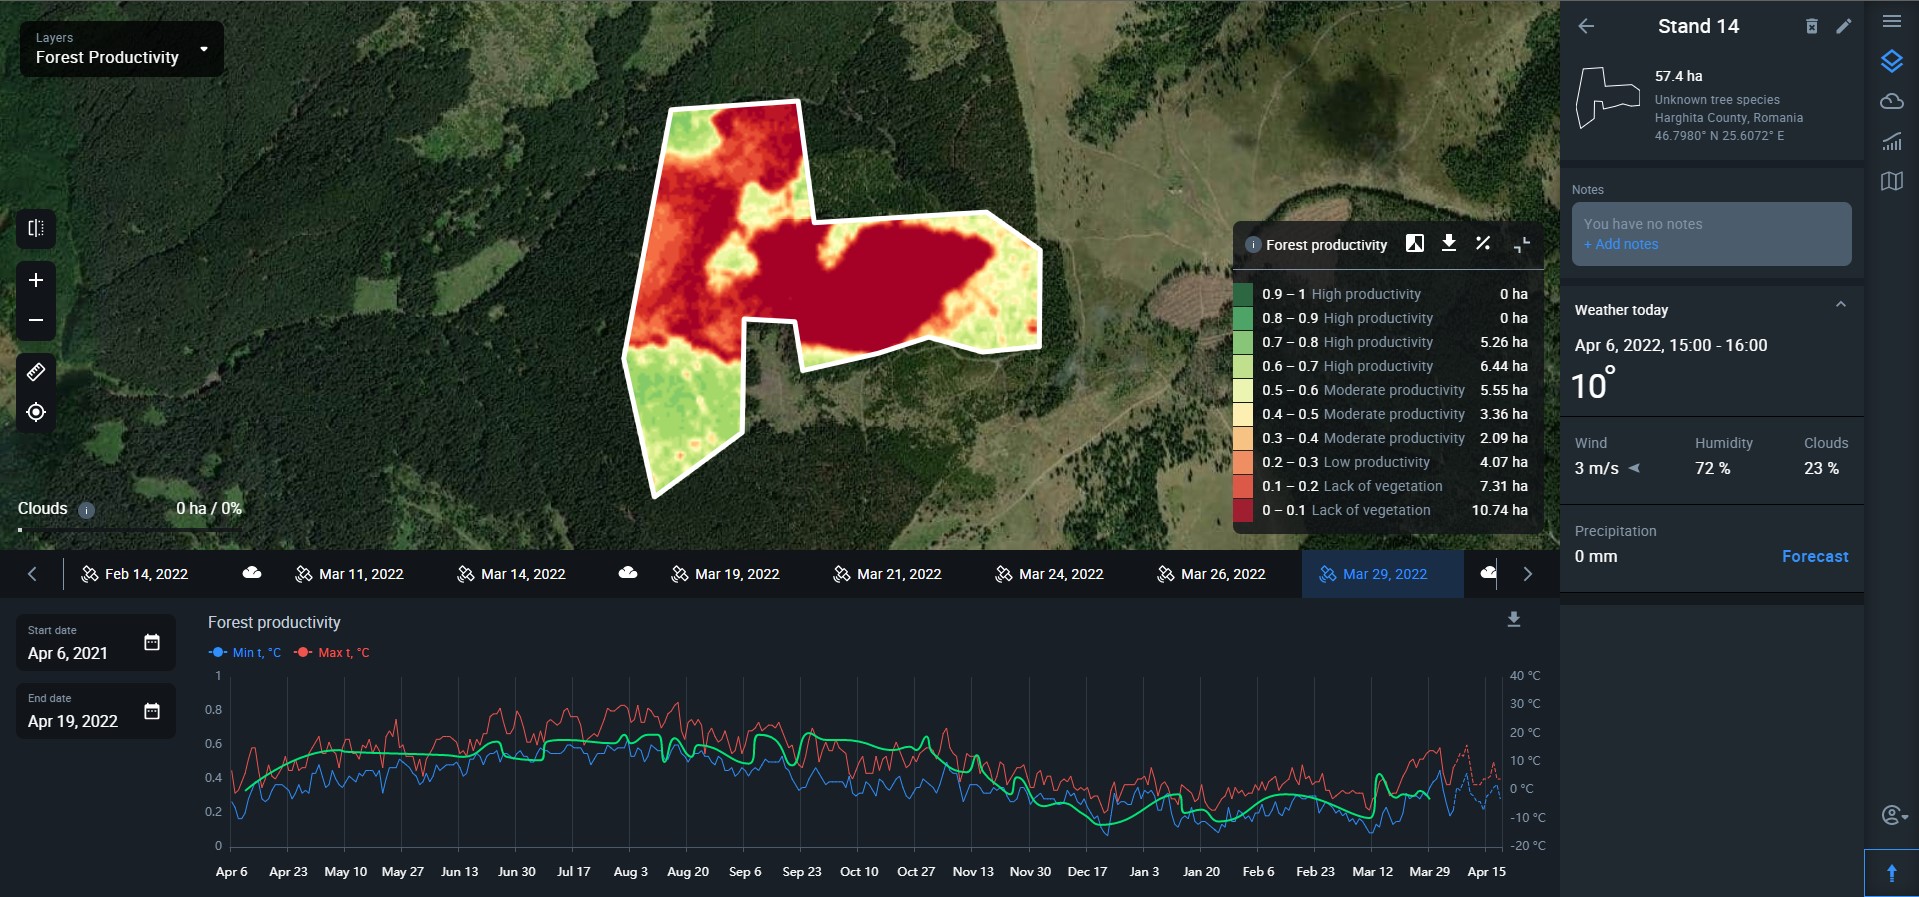
The legend contains detailed information
Tip: Use forest productivity values to measure the effectiveness of forestry operations soon after their completion.
Water Stress
Water stress is calculated as an index with values ranging from 0 to 1 where:
- 0 – 0.4 – high water stress, drought conditions
- 0.4 – 0.8 – no water stress
- 0.8 – 1 – waterlogging
Each value is visually represented by a certain color/hue.
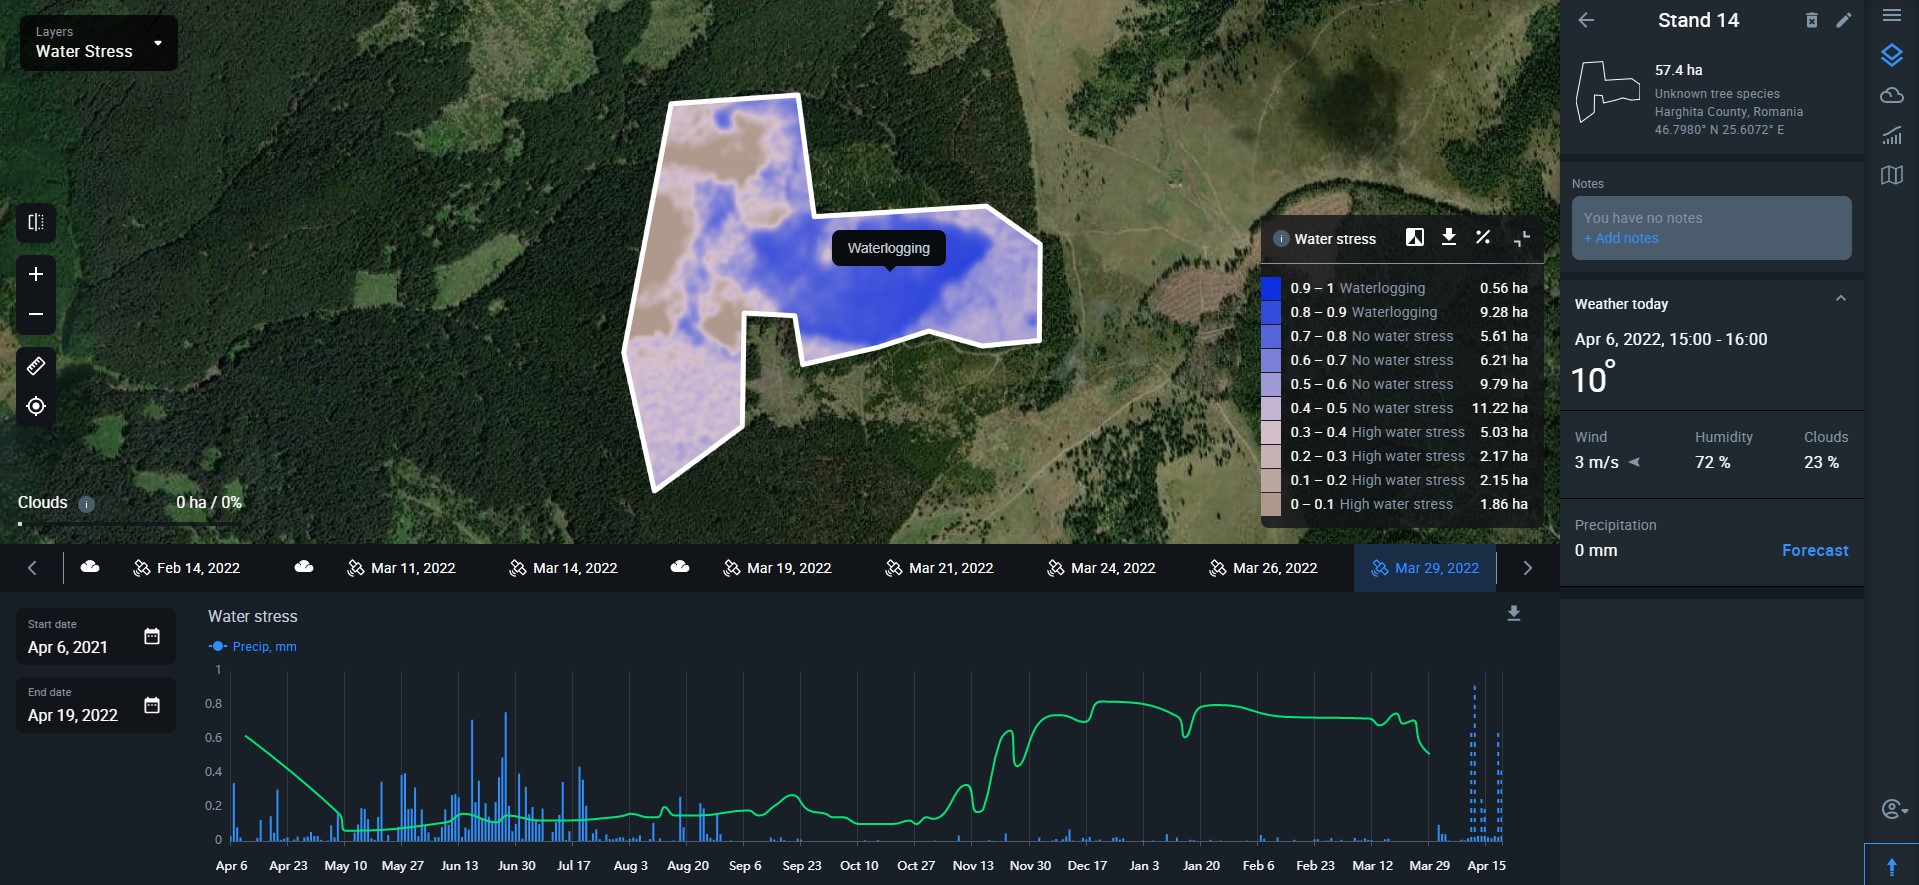
Generally, you want your forest stand to look pink or violet on the map, i.e. having no water stress. Lack of water will make the area appear brown on the map, while an excess of water will look blue.
White color stands for clouds that got into the satellite image of the stand on a particular date.
You can refer to the legend for more details.
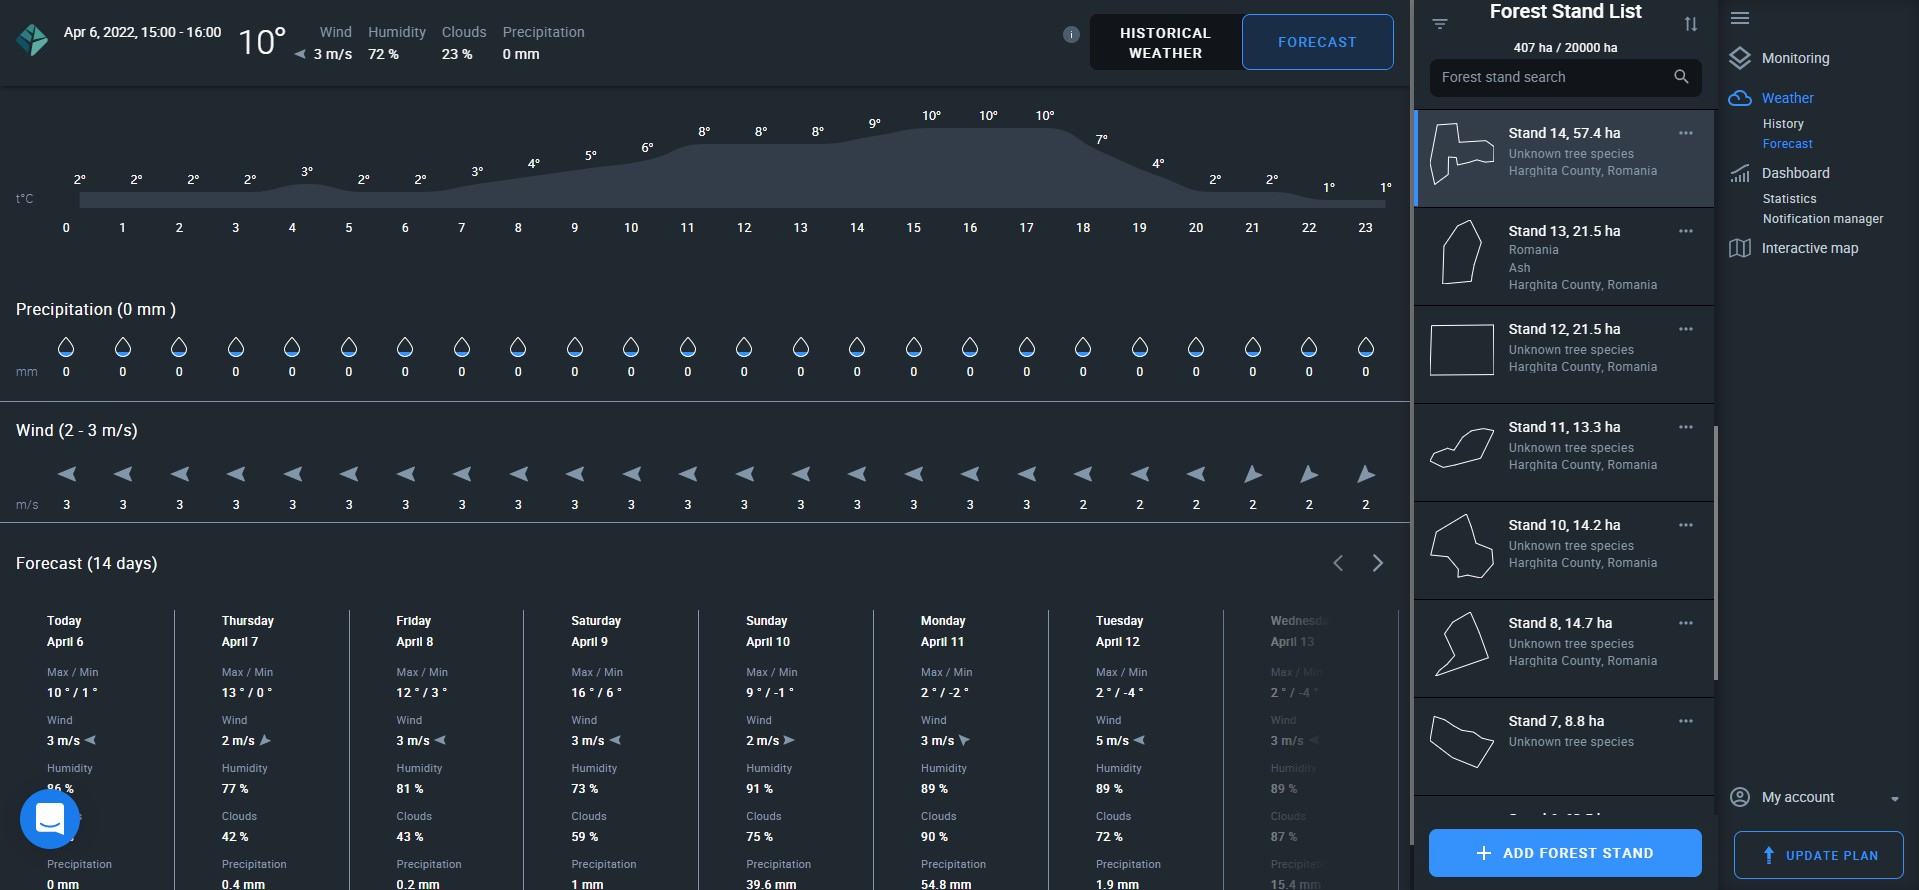
Weather Today
This section displays data for several key weather parameters near or within your stand changing in real time. These parameters are:
- Temperature
- Wind speed (m/s or mps)/direction*
- Humidity (%)
- Clouds (%)
- Precipitation (mm/inch)
*wind direction is shown by a little arrow sign next to the speed indication.
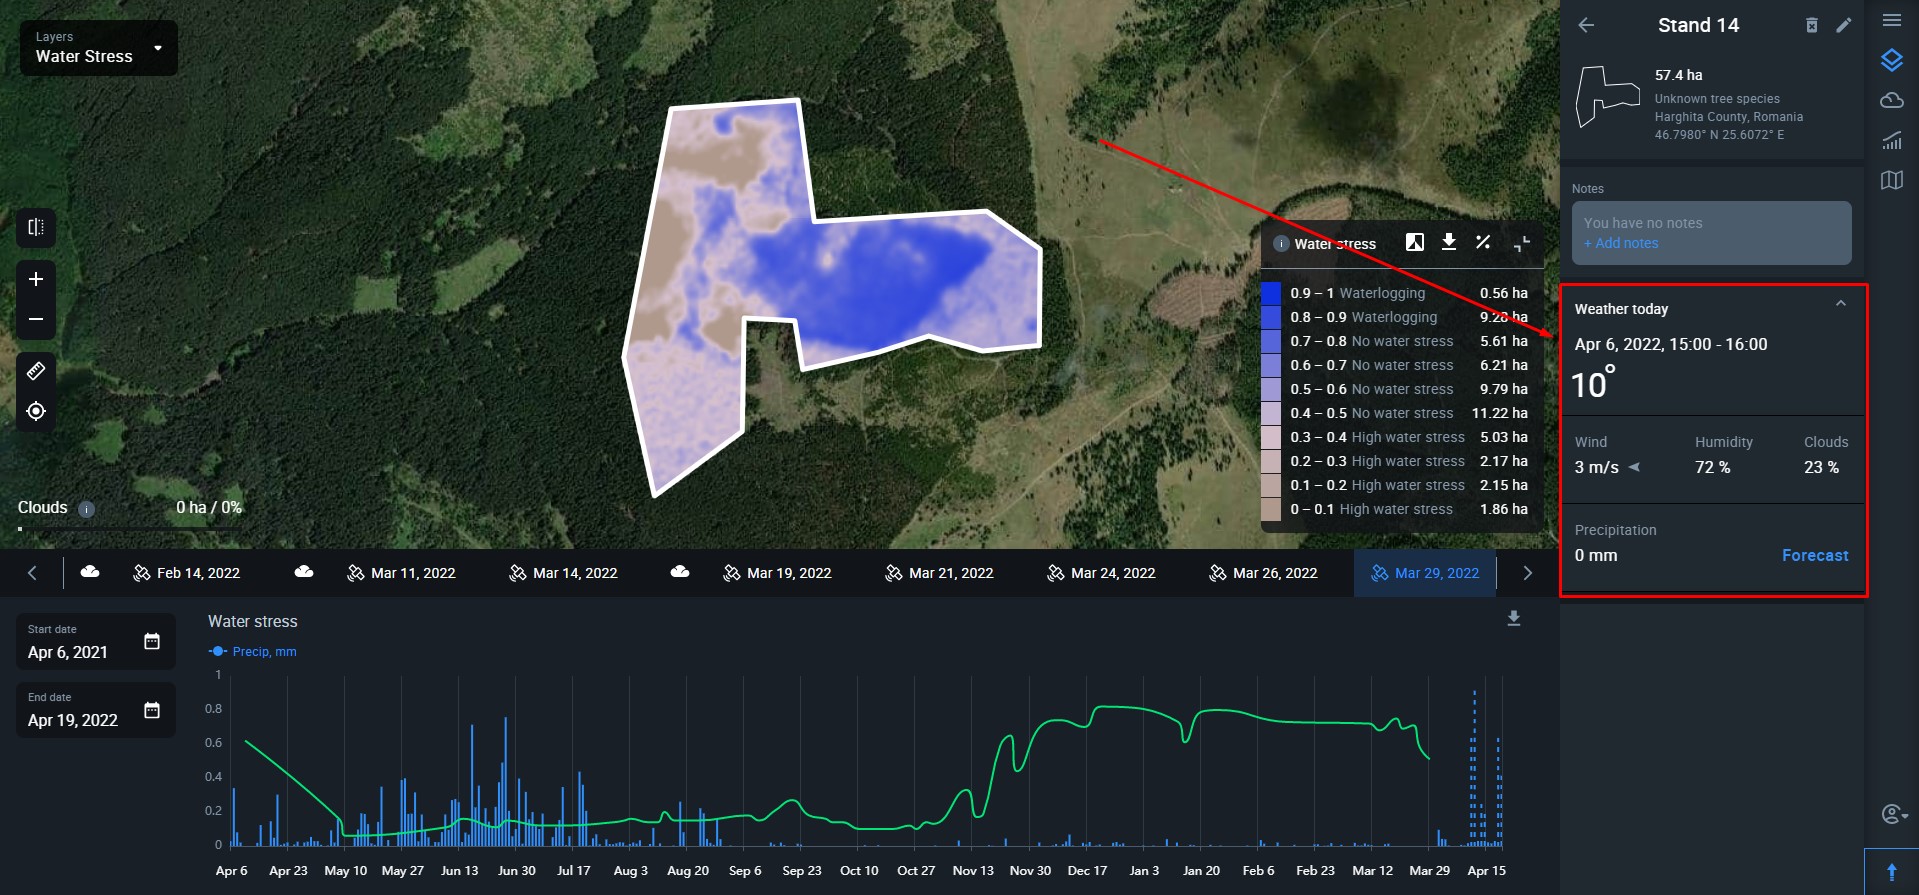
If you need to view a 14-day weather forecast, click on the “forecast” button In the bottom right corner of the section.
Use the Weather tab to better understand how suitable the climate is for the growth of different species of trees in your area of interest. The tab will help you estimate the vegetation periods for different tree species, as well as the amount of precipitation within the areas of interest (your forest stands).
In this tab, you can get access to:
- historical weather data collected since 2008 for all of your areas of interest;
- current weather data;
- 24-hour forecast;
- 14-day weather forecast.
Historical Weather
This section provides you with the data on the key weather parameters for a specific area of interest, and for any period that you have selected*, in a graph format.
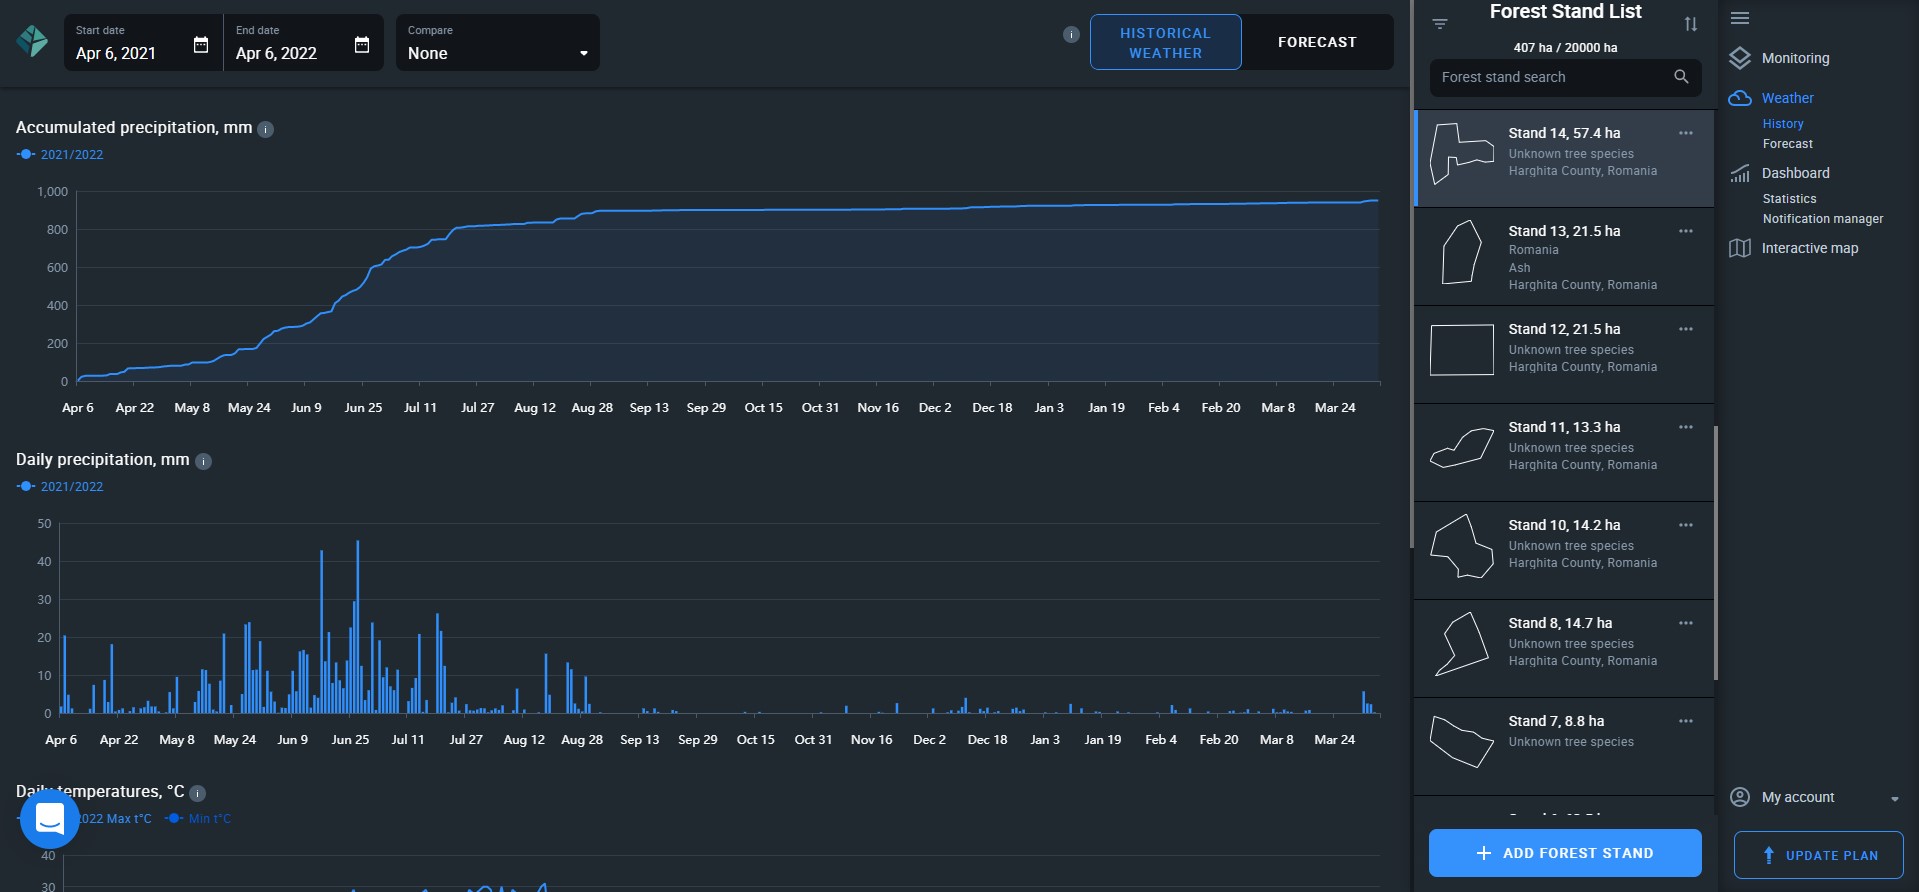
For now, we provide data on:
- Accumulated precipitation
- Daily precipitation
- Daily temperatures
- Sum of active temperatures
*At the moment, the maximum historical weather period you can select is 5 years.
How To Select A Historical Weather Period
On the upper bar, you see Start date, End date, and the Compare box.
- By clicking on the small calendar icon inside the Start date box, you open a calendar where you can select the year, month, and date.
- Once you click on the date, the calendar window will automatically close.
- Now, the Start date box will show you the date, month, and year you have selected.
Simply repeat these steps for the End date box, and, once you have both dates, the historical weather period has been selected.
Now let’s take a closer look at each historical weather parameter.
Accumulated Precipitation
This graph shows the amount of accumulated precipitation over a selected period. Water is an essential element in assimilation, dissimilation, gas exchange, and other natural biochemical processes. Water stress affects tree growth and leads to lower productivity. Use this graph to improve irrigation efficiency and increase forest productivity as a result.
Daily Precipitation
The graph shows the amount of daily precipitation on a selected forest stand. Rain and snow provide plants with moisture, nitrate salts, ammonia, and other minerals. Snow cover protects young plants from low temperatures and mechanical damage, as well as prevents frost from penetrating soil too deeply while letting meltwater permeate the soil. Too much snow, on the other hand, can cause a snow break – damage to the trees.
Daily Temperatures
On this graph, you can view the history of maximum and minimum daily temperatures on the forest stand. It allows you to analyze forest fire trends and get a better grip on the growing season time frame (start and end dates), as well as study extreme temperature trends. Use this data to make well-informed decisions to mitigate fire risks in a timely manner.
Sum Of Active Temperatures
The graph displays the sum of active temperatures for the selected forest stand. It allows you to analyze forest microclimate, determine whether this particular forest stand is suitable for planting certain tree species, and estimate the length of a growing season.
Compare
In order to better understand the weather patterns or trends for a given area of interest, you can compare data for a selected period on all of the graphs with the 5-year average data. For example, if you would like to see the history of daily precipitation on your forest stand for the past year, you could compare it with the 5-year average precipitation figure. Here’s what you need to do:
On the upper bar, there is a Compare box that is set to “None” by default.
Go ahead and click on the box and select “5 Years average”. It may take a few seconds for the graphs to adjust. Once it’s done, precipitation data for the past year will be displayed as blue vertical bars, while the 5-year average data will be in orange for contrast.
Forecast
In the Forecast tab, you will be able to check:
- current temperature,
- wind speed and direction,
- humidity percentage,
- cloudiness percentage,
- and precipitation in mm or inch.
Below, there is a 24-hour forecast that contains data on:
- hourly temperatures,
- precipitation in mm or inch,
- and wind data.
At the bottom, we display the 14-day weather forecast provided by our partner. It contains data on:
- max/min temperatures,
- wind speed and direction,
- humidity percentage,
- cloudiness percentage,
- and precipitation in mm or inch.
The Dashboard allows you to view crucial statistical data about all of your forest stands at once and manage notifications. For convenience, it is divided into two sections:
- Statistics
- Notification manager
Statistics
This section displays the data about changes within forest stands over the selected period* in:
- Deforestation;
- Forest productivity;
- Water stress.
*you can select a period manually
To switch between different types of data, select indicators from a drop-down on the top horizontal bar.
You can also control the arrangement of the data by making the system show you:
- All groups of stands;
- 1 or more groups of stands;
- All stands that are not grouped.
Reports
You can download stats for each indicator as a spreadsheet in PDF or XLS formats. To download a stat report, click on the button in the upper right corner of your screen.
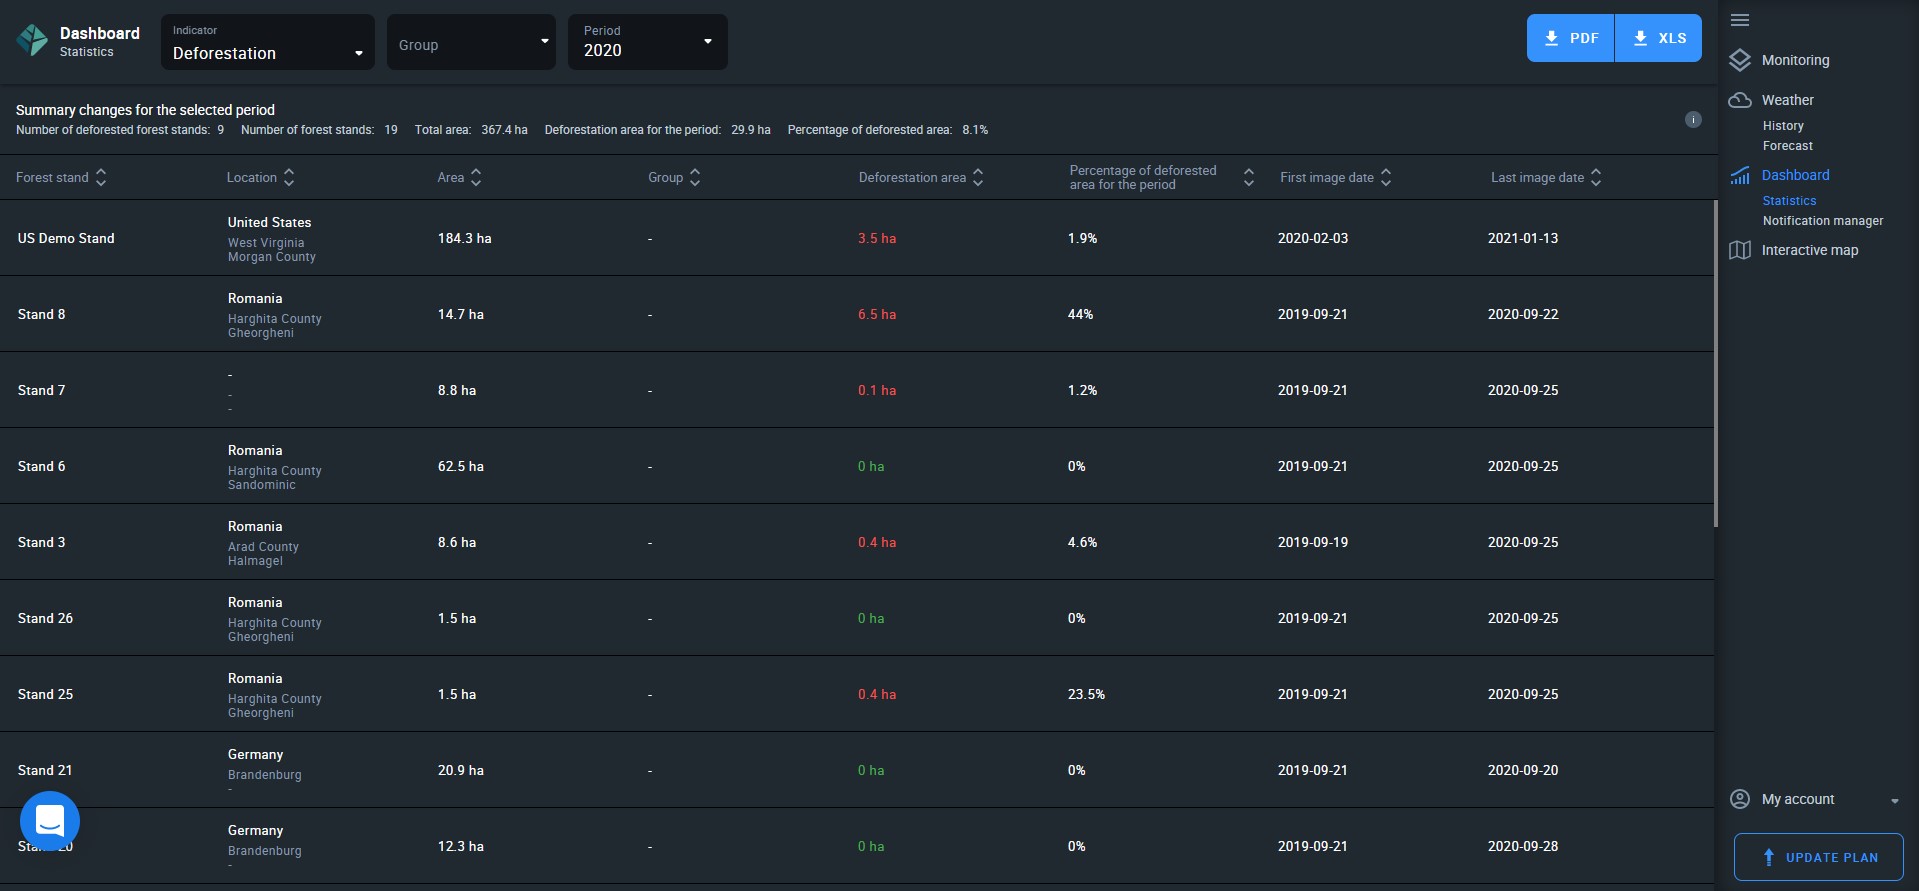
Deforestation Statistics
Statistics for deforestation are displayed for a period you can select in the Period drop-down menu on the top horizontal bar. The data is calculated based on the first and last cloudless images for the selected period.
There are four options:
- Month
- Quarter
- Year
- Custom dates*
*Contact our support team to set a custom period. You’ll need to add your phone number, company name, area size, and a short description of why you are making the request.
EOSDA Forest Monitoring interprets any loss of forest cover as deforestation, including
- logging operations,
- illegal logging,
- natural changes in forest cover.
Statistical data on deforestation is organized into columns:
- Forest stand name
- Location of forest stand
- Area of forest stand
- Group the stand is in
- Deforestation area*
- Deforestation percentage (extent)
- First image date
- Last image date
*how much forest has been lost over the specified period due to any causes.
Summary data on deforestation for all stands for a selected period are displayed right above the statistical data and include:
- total number of deforested stands
- total number of your forest stands
- total area of your forest stands
- total area of deforestation
- total percentage of deforested area*
*to give you an idea of the extent of deforestation that has occurred.
Note that calculating data can take some time. Data cannot be calculated if there are no available cloudless images for the selected period.
Important: if the selected period falls outside of the vegetation period for this stand, it will be highlighted in red.
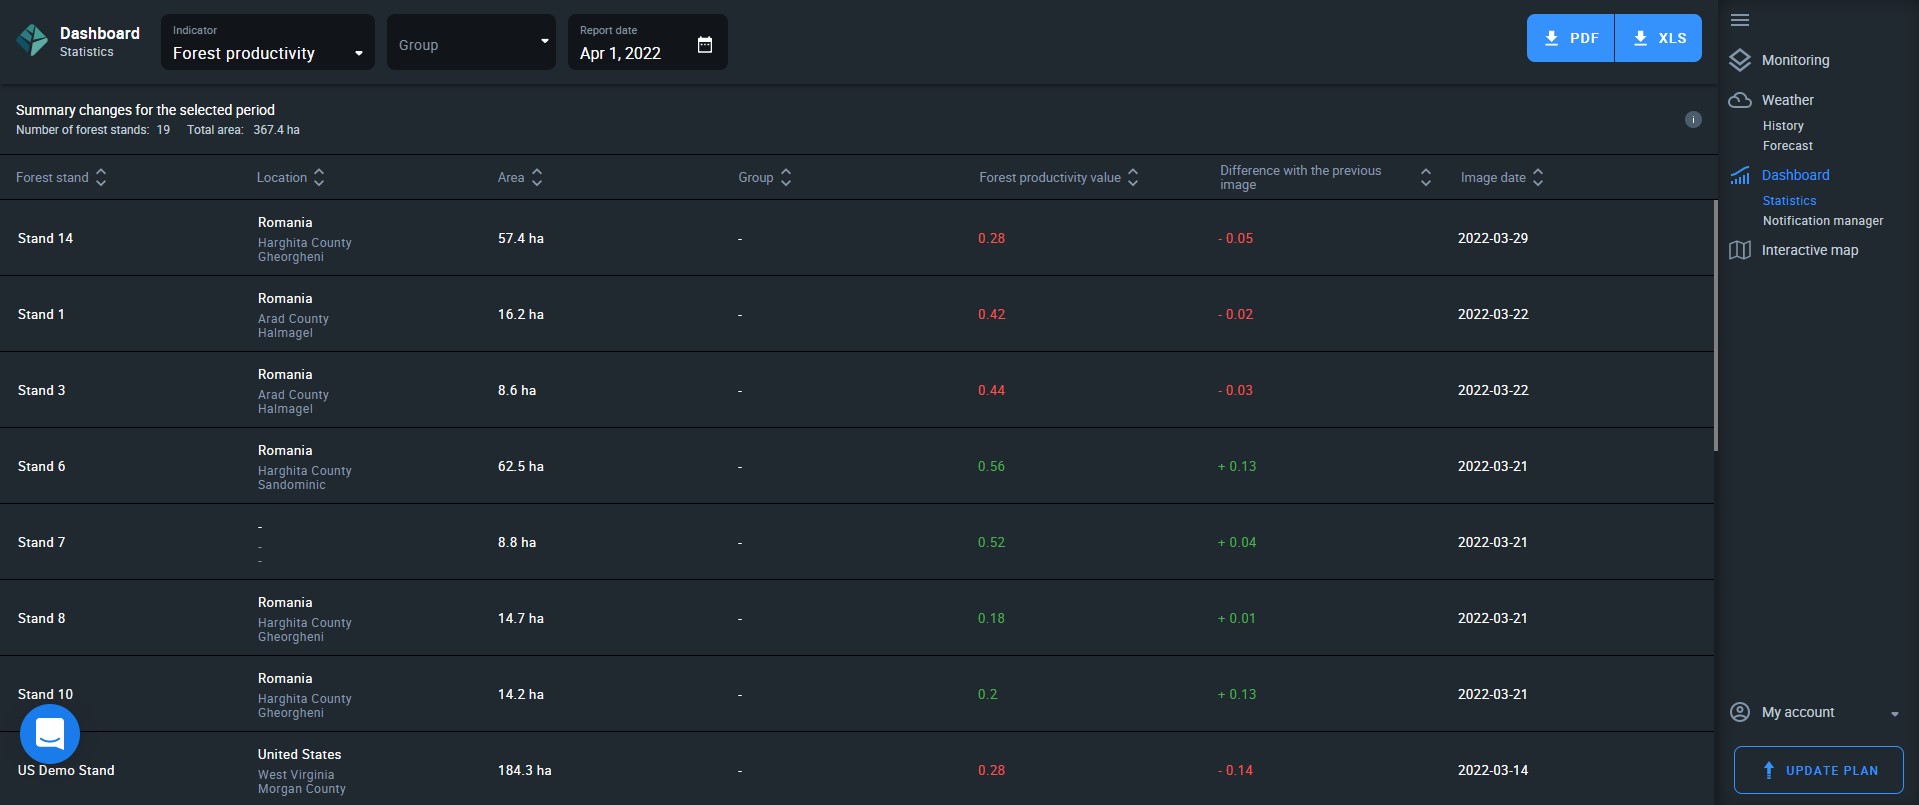
Forest Productivity Statistics
Statistical data on forest productivity is calculated as an index based on the last available image prior to or on the date you will select. The table will show you two values:
- Productivity for the selected date*
- Change in productivity since the previous satellite image
*If there was no satellite image of your stand for the selected date, the system will calculate the data based on the previous available image.
Forest productivity is measured as an index ranging from -1 (bare earth/poor health) to +1 (excellent health). Change in productivity compared to the previous available image is the difference between two index values.
E.g. You’ve selected a date with an index of 0.6, but on the date of the previous available image, the index measured at 0.8. Hence, the index of productivity has dropped by 0.2 units.
To select the date, click on the Report date box and pick a date on the interactive calendar. You can select report dates from January 1 2020 onward.
For convenience, summary data (total number of your forest stands and total area in ha or ac) are displayed right above the statistical data.
Water Stress Statistics
Statistical data on water stress is calculated as an index based on the last available image prior to or on the date you will select. The table will show you two values:
- Water stress for the selected date*
- Change in water stress since the previous satellite image
*If there was no satellite image of your stand for the selected date, the system will calculate the data based on the previous available image.
To select the date, click on the Report date box and pick a date on the interactive calendar. You can select report dates from January 1 2020 onward.
For convenience, summary data (total number of your forest stands and total area in ha or ac) are displayed right above the statistical data.

Notification Manager
Use this section of the dashboard to set up and manage regular email notifications on changes within your forest stands.
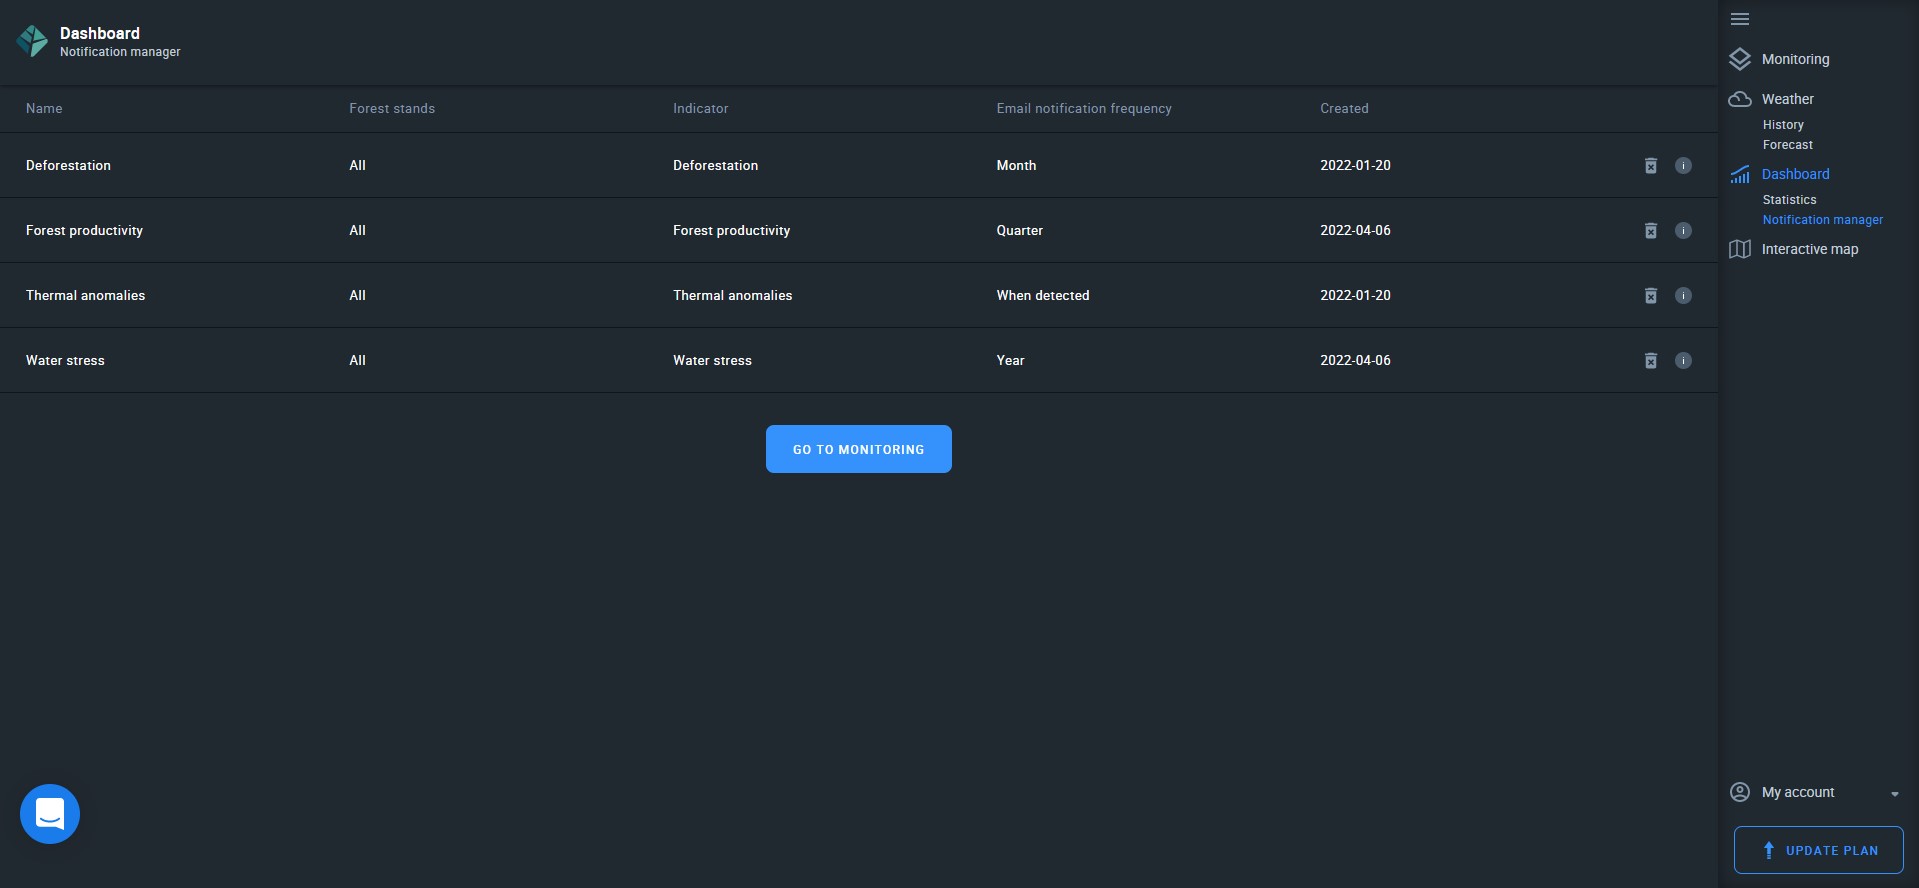
You can create 4 notifications (1 notification per indicator*):
- Forest productivity
- Water stress
- Deforestation
- Thermal anomalies
*you can only create 1 notification per 1 indicator. To change the name, frequency, or any other parameter of a notification, please delete and create it again.
Create a notification in 5 simple steps:
Step 1. Click on “create notification” at the center of the screen.
Step 2. Add a name. It can be anything that makes sense to you.
Step 3. Select an indicator from the drop-down.
Step 4. Select email notification frequency.
Step 5. Finish by clicking “Create”.
You can choose between several email notification frequency options:
- Once a month
- Once a quarter
- Once a year
These options apply to 3 indicators:
- Forest productivity
- Water stress
- Deforestation
The Thermal anomalies notification will be sent to your email on detection only.
Forest Productivity Notification
This email notification will contain a report on the most negative changes in productivity within your forest stands over the selected period. A report will only mention the top 3 stands (in case you have 3 or more) with the most negative changes.
The report should contain the following information about each stand:
- Location of the stand
- Name of the stand*
- Current forest productivity value for this stand
- Difference between the first and last images within the selected period
*the name you have given your stand
Water Stress Notification
This email notification will tell you which 3 of your forest stands (in case you have 3 or more) have the highest increase in water stress over the selected period. High increase in water stress may indicate drought conditions.
The report should contain the following information about each stand:
- Location of the stand
- Name of the stand*
- Current water stress value for this stand
- Difference between the first and last images within the selected period
*the name you have given your stand
Deforestation Notification
This email notification will contain a report on summary changes in forest cover due to deforestation (scheduled logging, illegal logging, natural causes, calamities, etc).
The report should contain the following information about all of your stands:
- Total number of forest stands you have
- Total number of stands where any type of deforestation has been detected
- Total area of forest stands you have
- Total deforested area
- Percentage of deforested area
The email may also include the information about the end of the vegetation period in one or more of your forest stands.
Thermal Anomalies Notification
This email notification will inform you about a potential fire threat within your forest stand(s). The notification will contain the number of forest stands. To further understand the danger of the fire threat, click on the GO TO MONITORING button.
We have created an interactive map of forest cover and deforestation for Ukraine as a demonstration of our mapping capabilities. You can task us with creating such a map for any region as large as a country.
You can use this section to:
- request access to the API*,
- send requests to our support team,
- change settings,
- upgrade plan,
- log out.
*contact us for more details
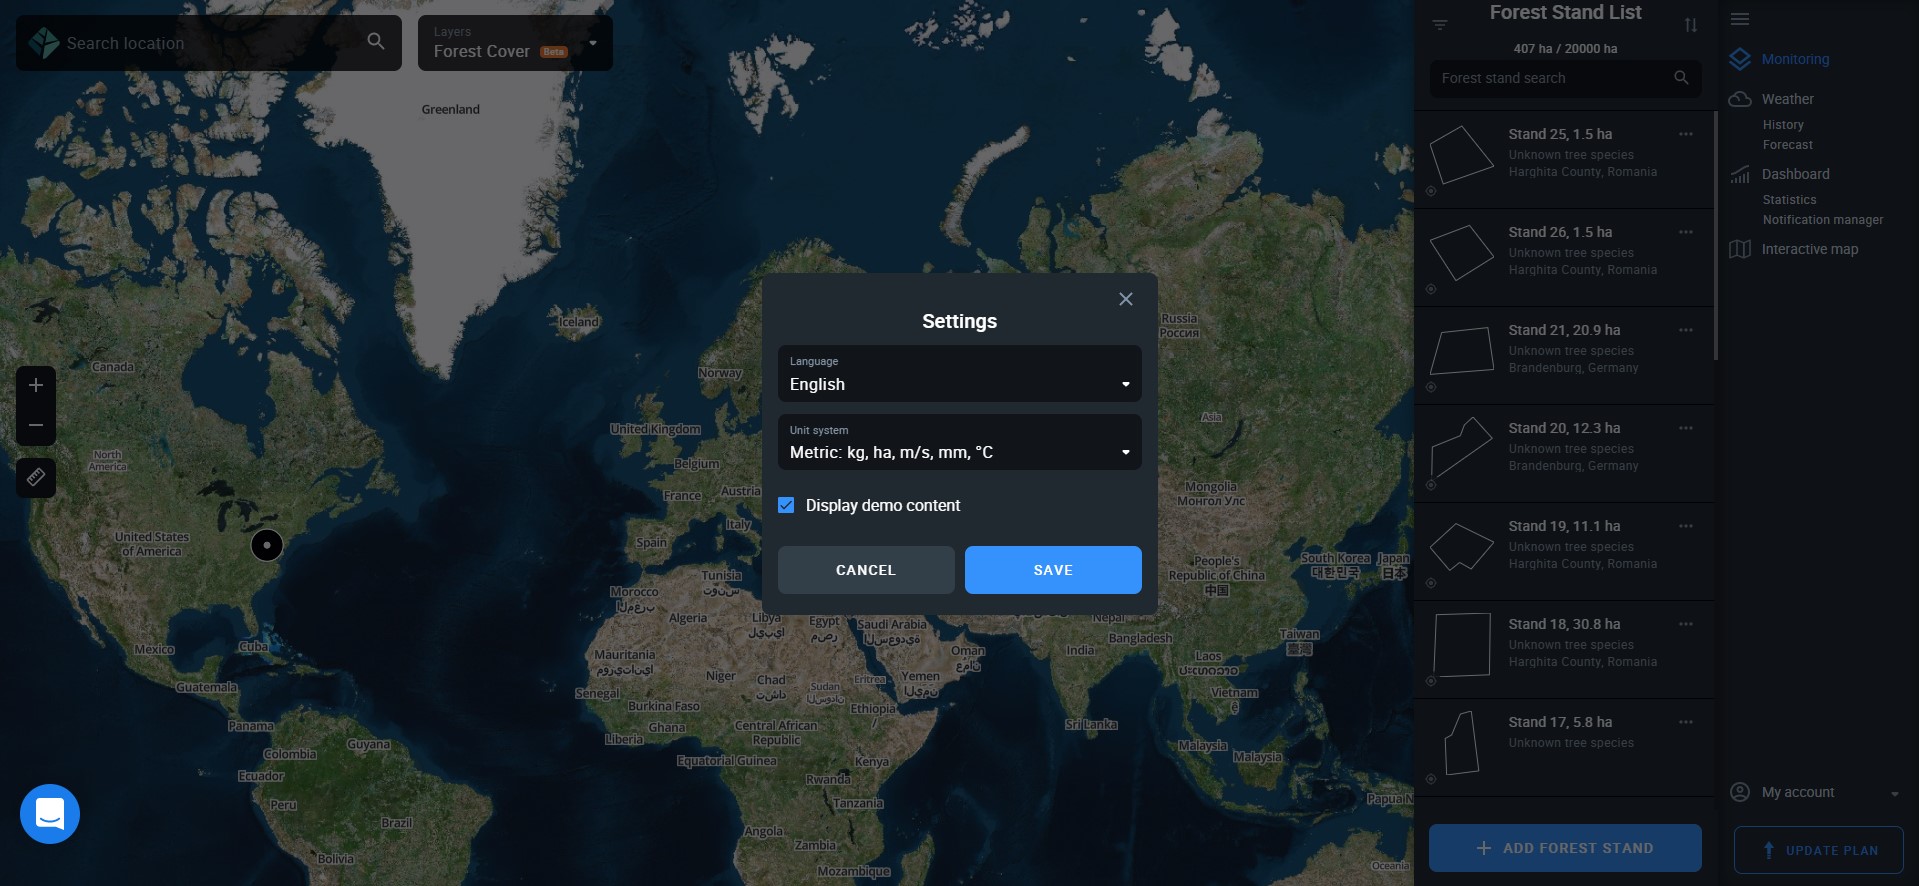
Settings
In the settings, you can:
- select the language of the interface
- select the unit system
- turn off the the demo content
Current version of EOSDA Forest Monitoring supports the following languages:
- English
- Portuguese
- Russian
- Spanish
- Ukrainian
You can choose between two international systems of units:
- Imperial (lbs, ac, mph, inch, °F)
- Metric (kg, ha, m/s, mm, °C)
You can hide the demo stand by turning off the “display demo content” toggle.
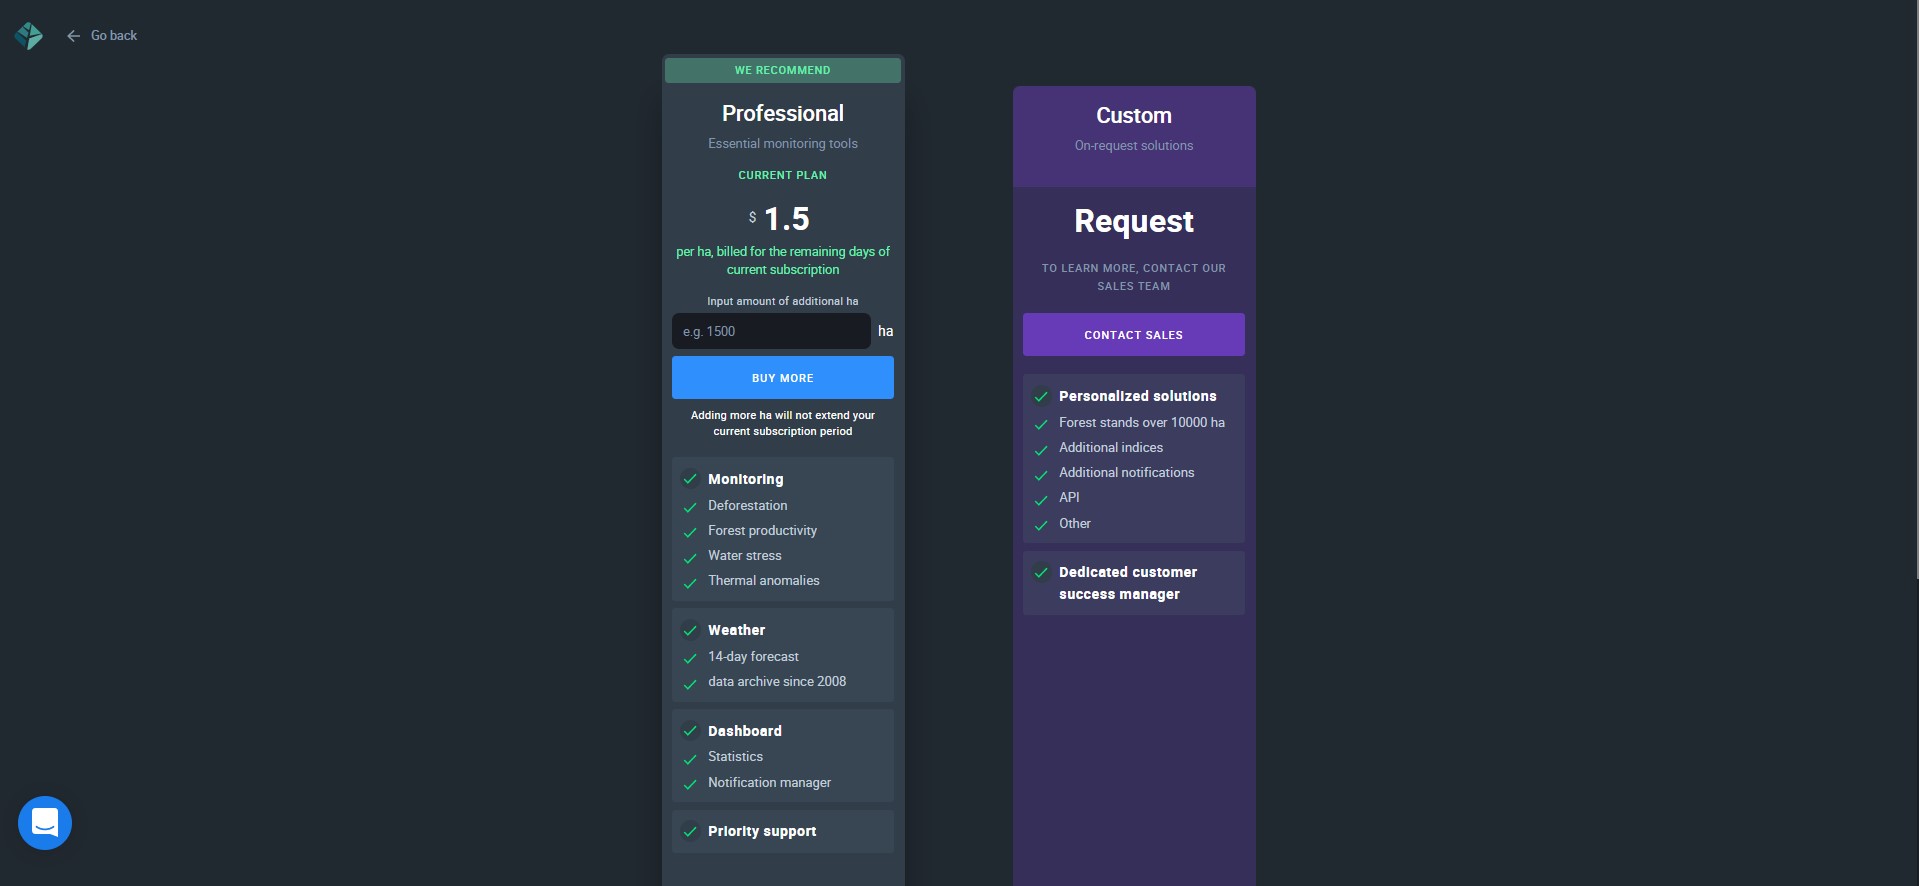
Pricing & Access
We offer two subscription plans: Professional and Custom. EOSDA Forest Monitoring is also available for free with limited access to features. You can try out all the features on your Demo stand first completely free of charge.
We are constantly working on providing you with the most actionable tools. Task us with developing additional forest management and monitoring solutions specifically tailored to your real cases.